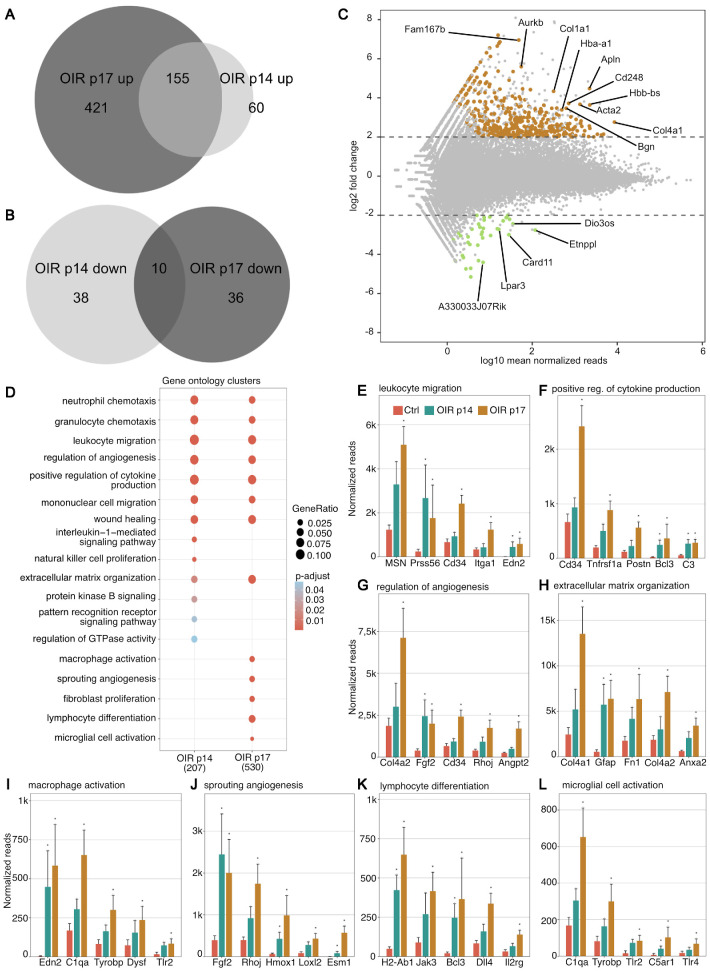
Figure 2.
Gene expression and gene ontology clusters differentially expressed in the oxygen-induced retinopathy model. Venn diagrams visualizing DEG between OIR p14 and OIR p17 groups that were upregulated (A) or downregulated (B) compared to respective control samples. Genes with log2FC >2 or <−2 and adjusted P value <0.05 were considered as DEG. This showed on overlap of 155 upregulated and 10 downregulated DEG in both groups. (C) Scatter plot showing the logarithm of normalized mean reads versus log2 fold change at OIR p17. Upregulated DEG are shown in brown, whereas downregulated ones are shown in green. The 10 most highly expressed and upregulated, as well as the five most highly expressed and downregulated, DEG are annotated. (D) GO enrichment analysis based on the 207 DEG at p14 and 530 DEG at p17 that were included in the GO database. The adjusted P value of each GO term is color-coded. The gene ratio describes the ratio of the count to the number of all DEG and is coded by circle size. If no circle is shown at a time point, the adjusted P value was not statistically significant (>0.05). (E–L) The five most highly upregulated DEG within each GO cluster and their normalized reads in controls (nOIR p14 + nOIR p17, red), OIR p14 (green), and OIR p17 (brown) are shown.

