Figure 3.
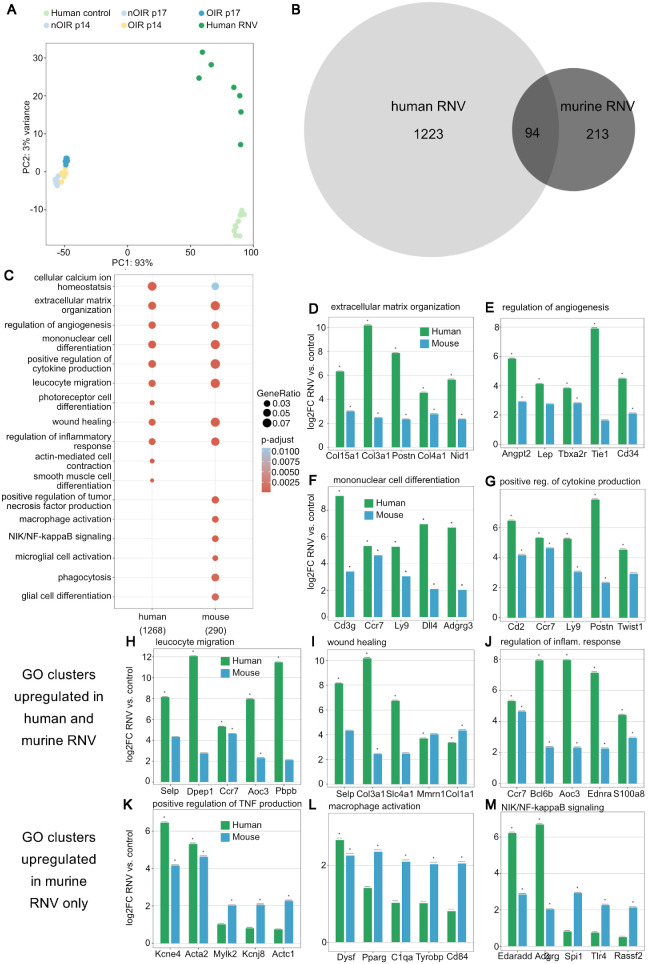
Comparison of transcriptome changes in human and murine retinal neovascularization. (A) PCA of human epiretinal gliosis membranes from macular pucker patients (light green), human RNV membranes from PDR patients (dark green), murine controls (nOIR p14 and nOIR p17, light blue), OIR p14 (yellow), and OIR p17 (dark blue) samples. A clear clustering of the samples from each group can be observed. (B) Venn diagram showing DEG that are upregulated in human and murine RNV, as well as those upregulated in both species. (C) GO terms upregulated in human and murine RNV reveal that genes involved in angiogenesis as well as immune response are upregulated in both species. The analysis is based on the 1268 human DEG and 290 murine DEG that were included in the GO database. The adjusted P value of each GO term is color-coded. The gene ratio describes the ratio of the count to the number of all DEG and is coded by circle size. (D–J) The five most highly upregulated DEG within each GO cluster and their logarithmic fold change in RNV versus control for human (green) and murine (blue) samples are shown. Almost all of these genes are more significantly upregulated in human than in murine samples. (K–M) The five most highly upregulated DEG in those pathways that are predominantly activated in murine RNV are presented with their logarithmic fold change in RNV versus control.

