
Fig. 3.
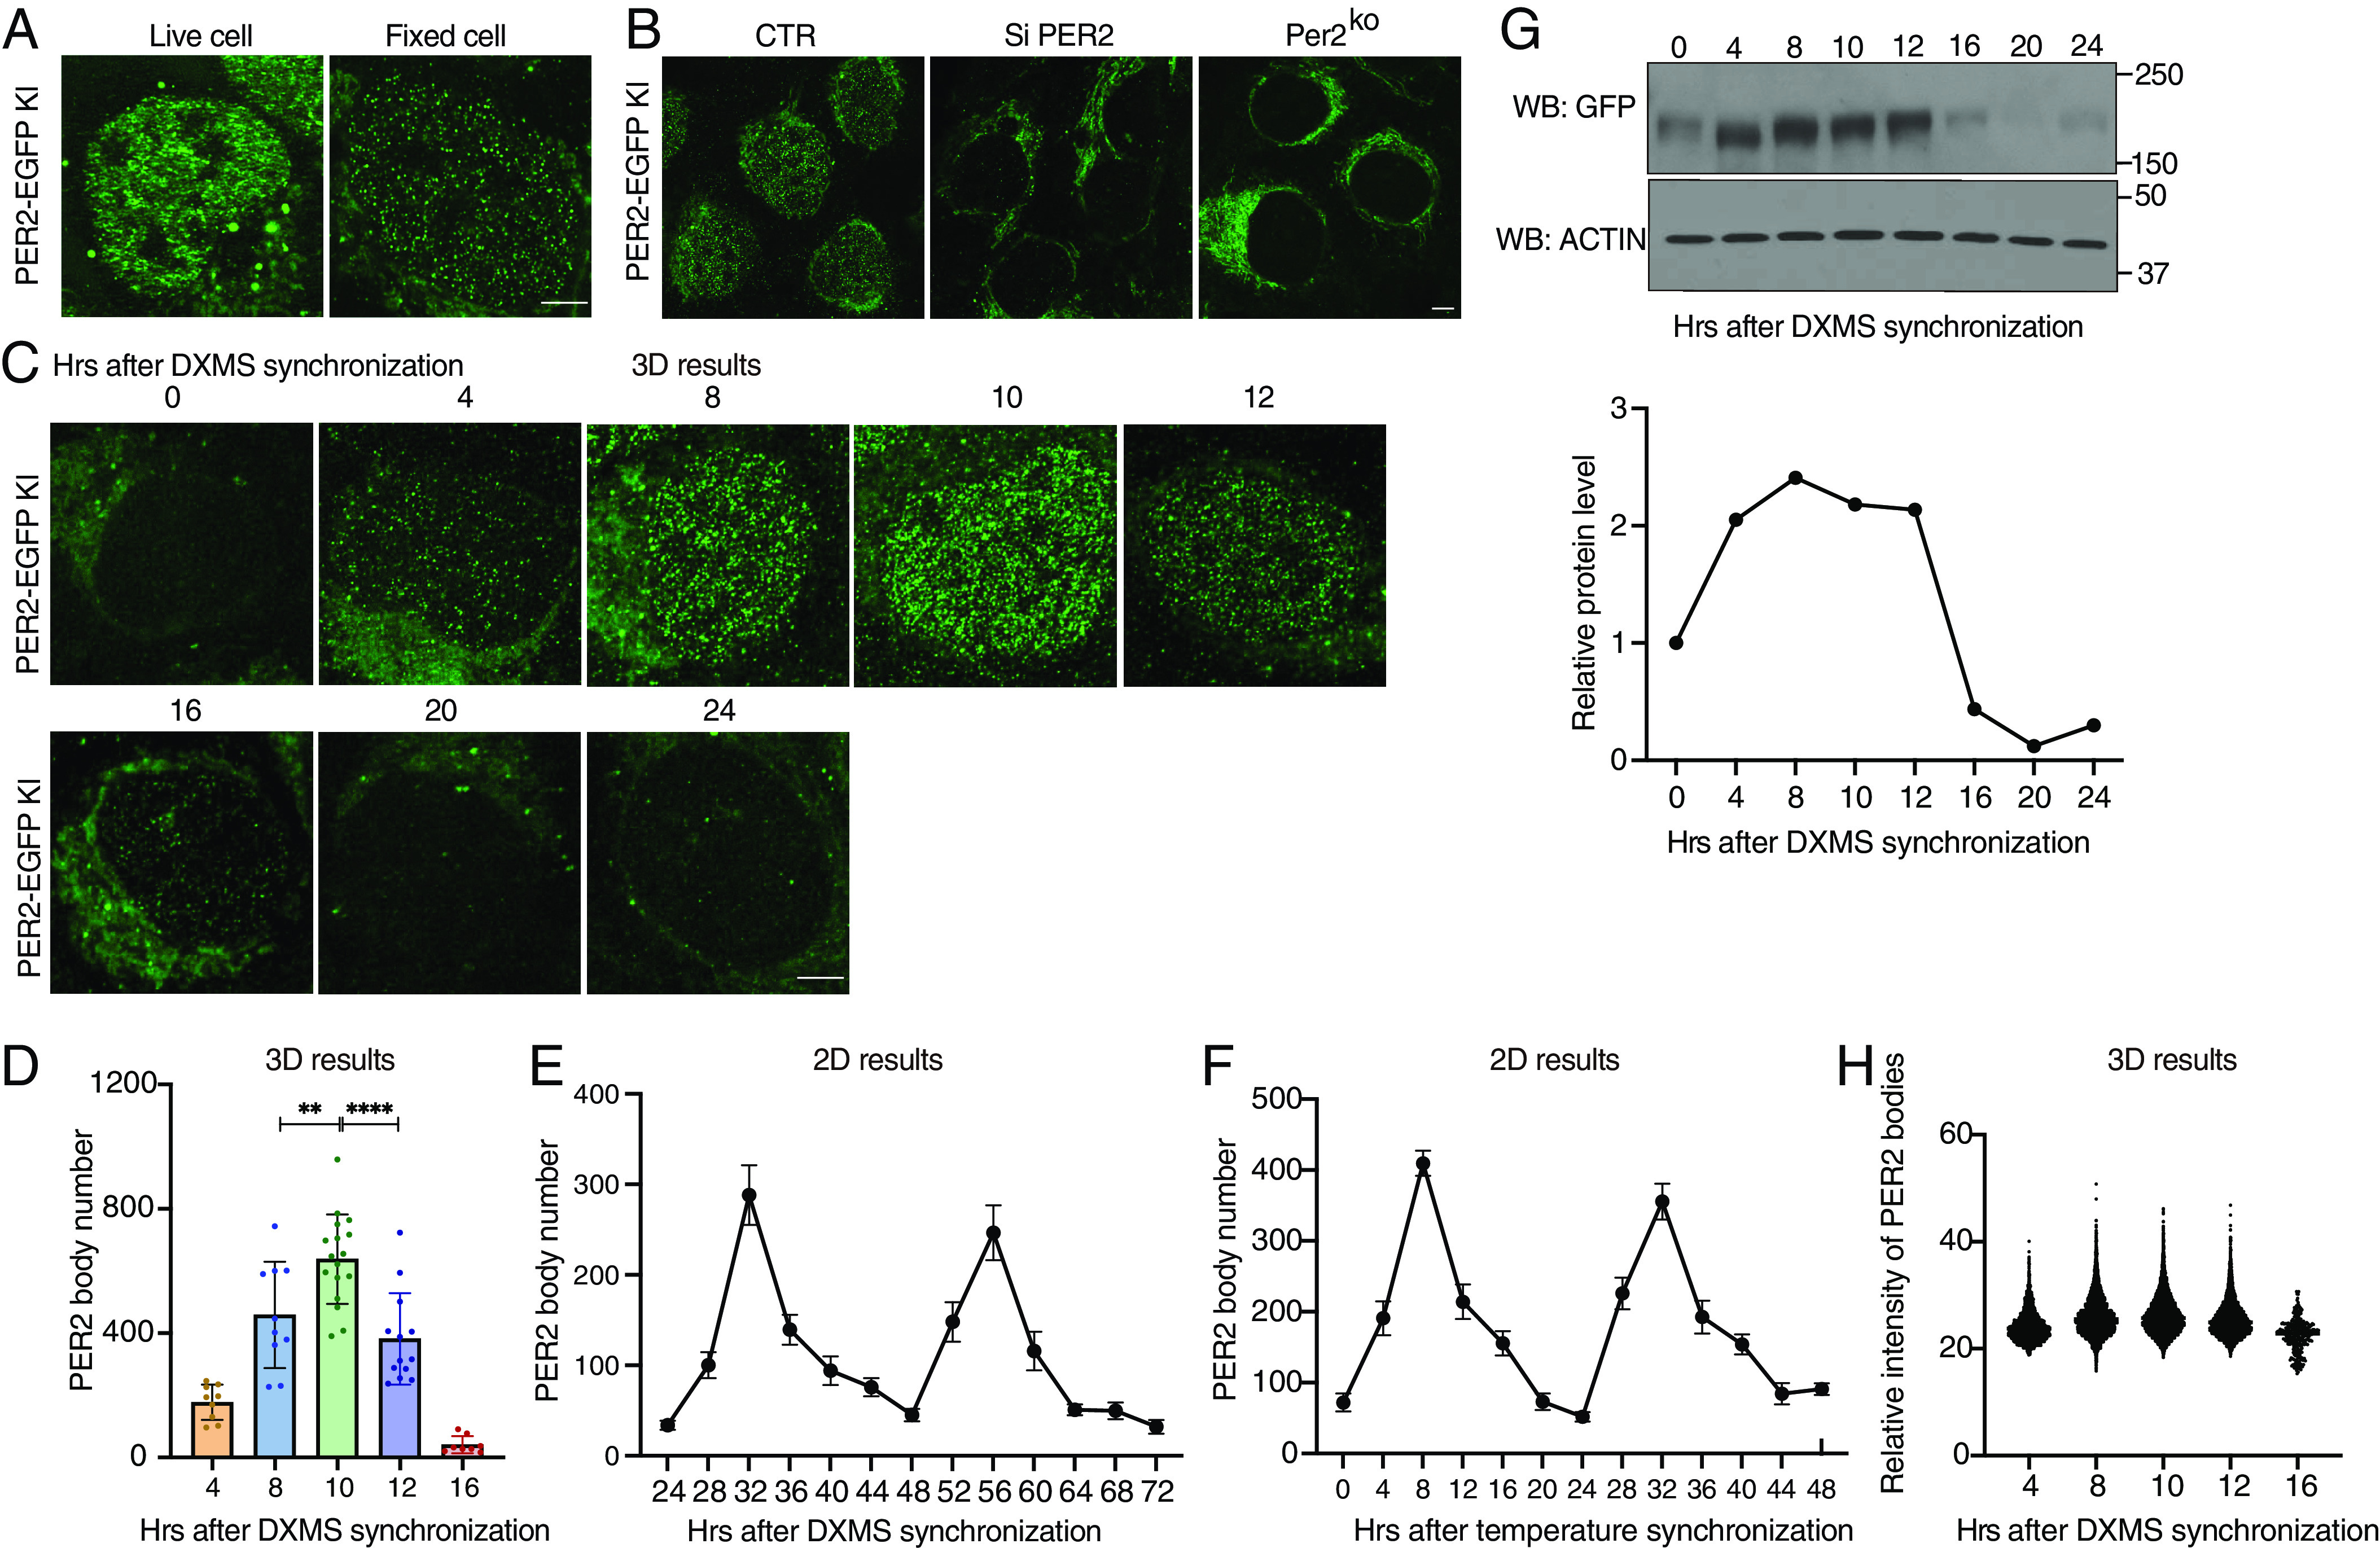
Super-resolution imaging of PER2-EGFP KI cells showing PER2 is concentrated in nuclear microbodies. (A) Airyscan confocal imaging of live (Left) and fixed (Right) PER2-EGFP KI cells in the nucleus. (Scale bar: 5 μm.) (B) Airyscan imaging of fixed PER2-EGFP KI cells (Left), KI cells treated with Per2-specific siRNA (si-PER2), and Per2KO cells. (C) Time course 3D imaging results of nuclear GFP signals in PER2-EGFP KI cells after dexamethasone synchronization. Representative 2D images from the 3D results are shown. (D) Numbers of nuclear PER bodies at different time points after dexamethasone synchronization (n = 8 to 17 cells), unpaired two-tailed Student’s t test. (E and F) Quantification of the PER2-EGFP microbodies of time course 2D imaging results of the PER2-EGFP KI cells after dexamethasone synchronization from h 24 to 72 (E) or after temperature cycle synchronization from h 0 to 48 (F). (G) Top: Western blot of EGFP in PER2-EGFP KI cells after dexamethasone synchronization. Equal amount of protein was loaded in each lane. Bottom: Quantification of PER2-EGFP levels. (H) Nuclear PER body mean fluorescence intensities after dexamethasone synchronization (n = 8 to 17 cells).