Fig. 6.
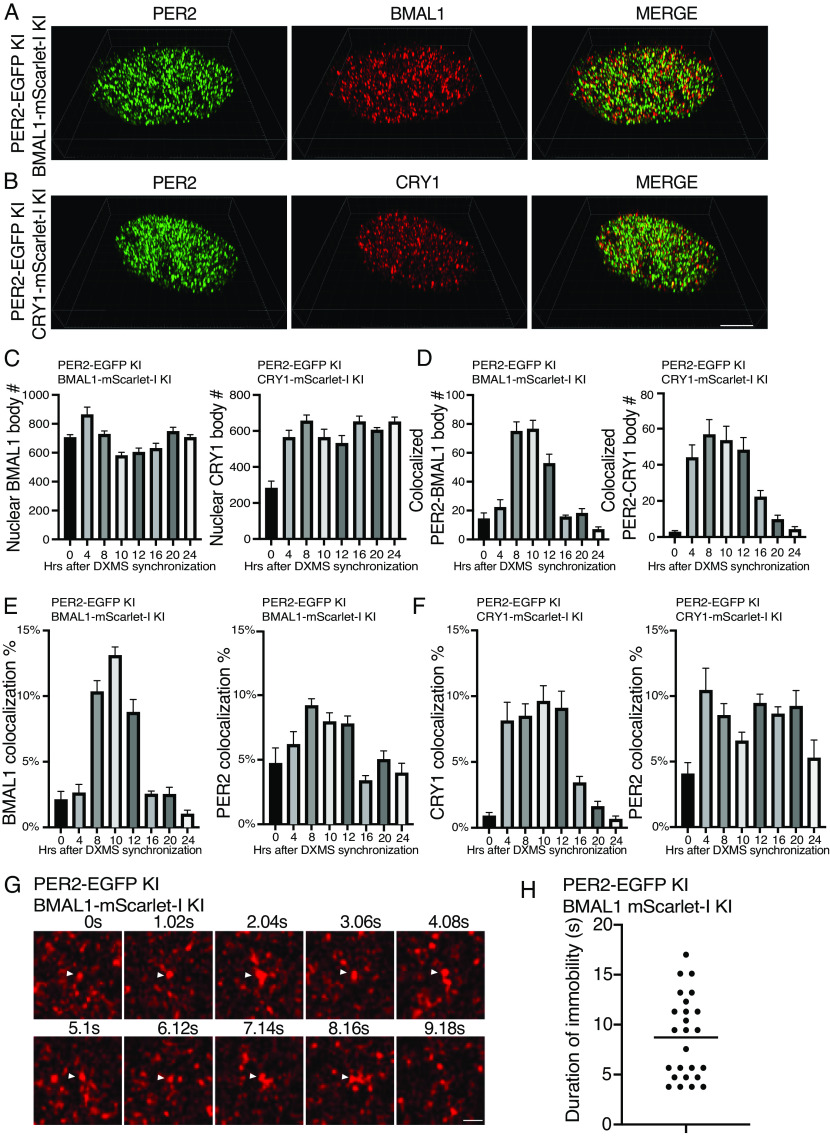
Airyscan imaging analyses of double KI cells showing that most PER2 bodies do not associate with BMAL1/CRY1 and the DNA residence time of BMAL1. (A and B) 3D Airyscan imaging result of PER2-EGFP and BMAL1/CRY1-mScarlet-I double KI cells at hour 10 after synchronization. Representative converted 2D nuclear images were shown. The 3D Airyscan imaging results for other time points are presented in SI Appendix, Supplemental Data Files. (Scale bar: 5 μm.) (C) Numbers of BMAL1 bodies and CRY1 bodies after dexamethasone synchronization in the double KI cells. Data are means ± SEM (n = 8 cells). (D) Numbers of PER2 and BMAL/CRY1 foci that colocalize after dexamethasone synchronization. Threshold distance for colocalization was set <100 nm. n = 8 cells. (E and F) Percentages of BMAL1/CRY1 and PER2 foci that colocalize after synchronization in the indicated PER2 and BMAL1/CRY1 double KI cells. n = 8 cells. (G) Time series of live cell Airyscan imaging of nuclear BMAL1 foci in the BMAL1-mScarlet-I knock-in cells. The arrow indicates immobile BMAL1 foci. Frame rate: 1.02 s/frame. (Scale bar: 5 μm.) (H) Summary of duration of immobility of identified immobile BMAL1 foci in the BMAL1-mScarlet-I KI cells. n = 10 cells.

