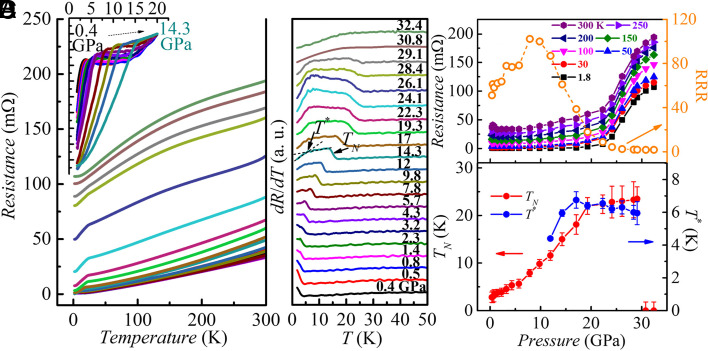
Fig. 1.
Pressure dependence of electrical resistance and TN. Temperature dependencies of the (A) electrical resistance and (B) temperature derivatives of the resistance for single crystal EuPd3S4, measured at different pressures. (A) and (B) share the same legend. The Inset in (A) shows the zoomed-in resistance curves normalized at 20 K from 0.4 GPa to 14.3 GPa so as to better show the evolution of TN below 14.3 GPa. In (B), curves at various pressures are offset from each other so as to better show the evolution of TN. TN is determined as the midpoint of the dR/dT shoulder, and T* is defined as the intersection of two black dashed lines drawn from high temperature and low temperature. (C) Resistance at various temperatures and the residual resistivity ratio (RRR) as functions of pressure. (D) TN and T* as functions of pressure.

