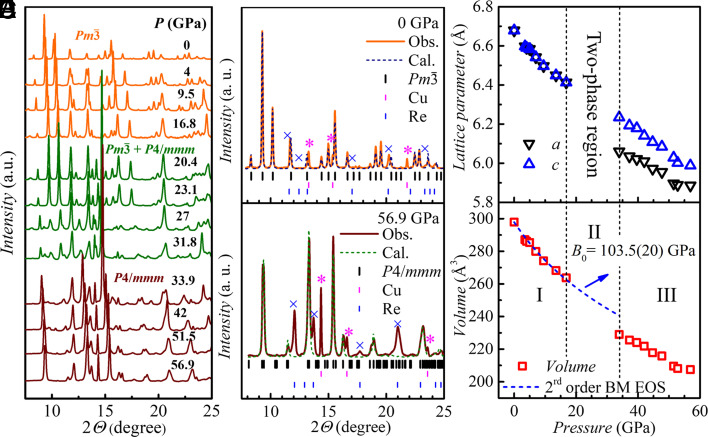
Fig. 2.
Pressure induced structural phase transition. (A) Selective powder X-ray diffraction (PXRD) patterns of EuPd3S4 at various pressures from 0 GPa to 56.9 GPa. The synchrotron X-ray wavelength λ is 0.4833 Å. The data were collected at room temperature. The full set is shown in SI Appendix, Fig. S1. (B) Rietveld refinement of the PXRD pattern at ambient pressure. (C) Le Bail fit to the high-pressure P4/mmm structure at 56.9 GPa. The pink stars and blue crosses in (B) and (C) represent the clear extra peaks in the PXRD spectra of copper (pressure manometer) and rhenium (gasket), respectively. (D) Pressure dependences of the refined lattice constants a and c. (E) Pressure dependence of the unit cell volume. The blue dashed curve shows the fitting by second-order Birch–Murnaghan equation of state (BM EOS). Several sets of independent PXRD measurements in zone I have been performed and show the same evolution of volume with the pressure. A more detailed plot is shown in SI Appendix, Fig. S5.

