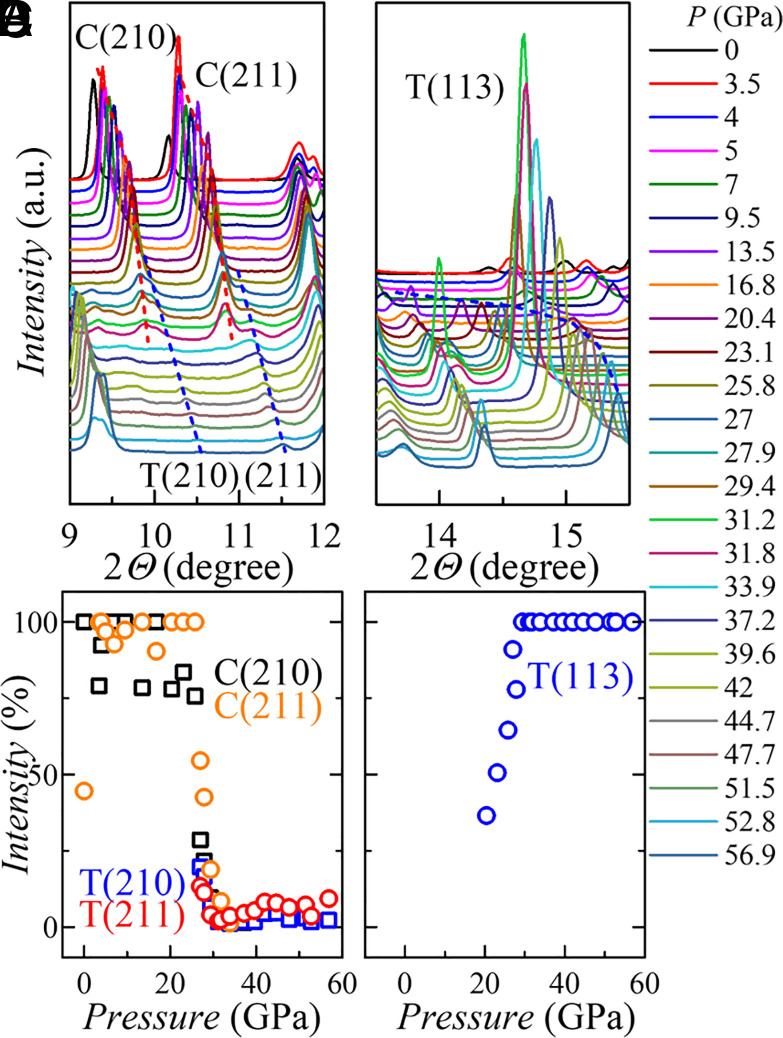
Fig. 3.
The evolution of diffraction peaks with the pressure in selected 2θ ranges. (A), (B) the cubic phase (210) and (211) (“cubic” is identified by “C”) to tetragonal (210) and (211) (“tetragonal” is identified by “T”); (C), (D) the emergence of T(113). (A) and (C) share the same legend. The red and blue dashed curves in (A) and (C) are the smooth guides to the eye of the position change of diffraction peaks. The percentage of the intensities in (B) and (D) are estimated by: (intensity of peak)/(maximum peak intensity in the spectrum).

