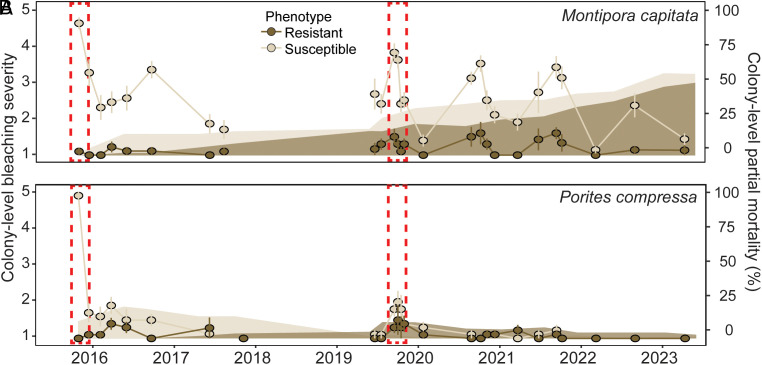
Fig. 3.
Bleaching and mortality response of individual bleaching-resistant and bleaching-susceptible corals over time. Colony-level bleaching severity (solid lines; mean ± SE) and cumulative colony-level partial morality (shading; mean) from September 2015 to April 2023 for individual colonies of (A) M. capitata (n = 9 to 10) and (B) P. compressa (n = 7 to 10). Colony-level bleaching severity was visually determined for each colony following the methodology of ref. 34, where (1) represents 0% bleached and (5) >80% bleached. Dashed red rectangles indicate the 2015 and 2019 marine heatwaves.

