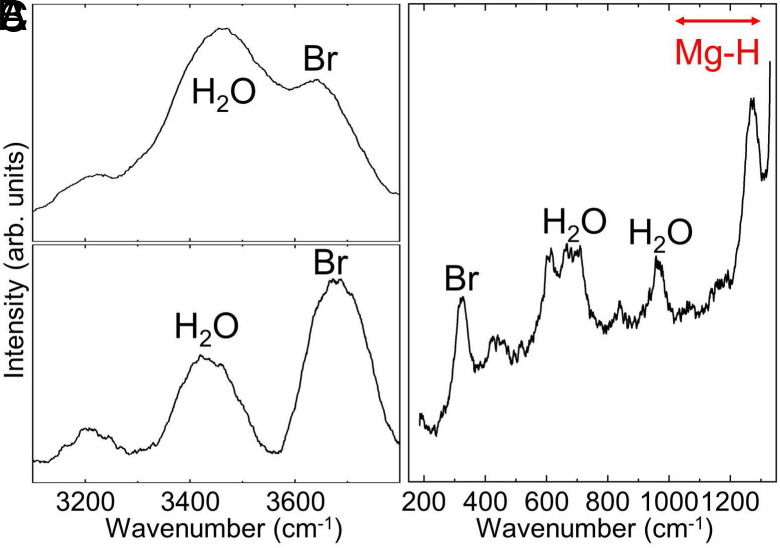
Fig. 3.
Raman spectra measured at (A) 7.0 GPa for the sample heated at 12.5 GPa and 4,770 K (#31-005), and (B) 11.5 GPa and 3,820 K (#31-003), and (C) 22.0 GPa for the sample heated at 26.0 GPa and 4,870 K (#26-009) (SI Appendix, Table S1). SEM data for the sample in (C) is presented in SI Appendix, Fig. S12. HO: HO-VII and Br: Mg(OH).

