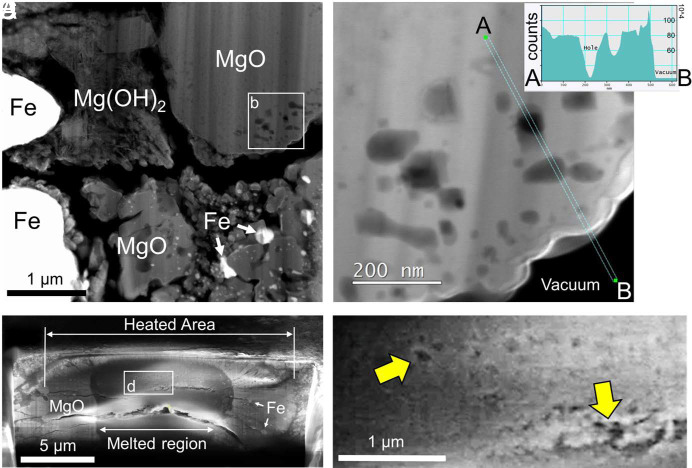
Fig. 4.
STEM (A and B) and SEM (C and D) images of the heated areas in the samples recovered from run #31-003 (11.5 GPa and 3,820 K) and #26-009 (26 GPa and 4,870 K), respectively (SI Appendix, Table S1). (A) An FIB section shows some of the phases found in XRD. The small bright grains are bcc Fe metal (labeled as Fe) converted from fcc FeH during decompression (34). The diffraction pattern for the converted Fe metal can be found in SI Appendix, Fig. S7. The Fe grains in the left side are not heated. (B) Bubble-shaped structures are found along the edge of MgO grans (a white box in A). An intensity line profile between point A and point B is shown in the inset. (C) A cross-section of the laser-heated area in the sample foil was made in FIB to reveal the structures. The center of the heated area contains more MgO and the surrounding area contains more Fe metal. Some Fe metal may migrate during melting along the radial thermal gradients. (D) A magnified image (a white box in C) reveals the bubble-shaped structures (highlighted by yellow arrows) within the heated area, similar to the ones observed in (B) but in larger sizes (note the scale difference).

