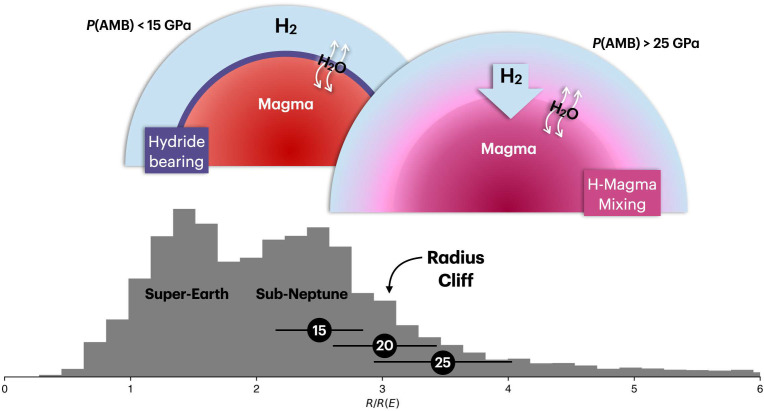
Fig. 5.
An exoplanet size demographics histogram up to (: radius, : Earth’s radius; Bottom) shown together with the implications of our experiments on the radius cliff (Top). Schematic diagrams for the structures of sub-Neptunes with GPa and GPa are shown (AMB: atmosphere–magma boundary). In the histogram, three horizontal bars show the estimated radii of sub-Neptunes (2 wt% H atmosphere with an Earth-like interior composition) for different pressures (in GPa) at the atmosphere–magma boundary (see SI Appendix, Text 5 for method).

