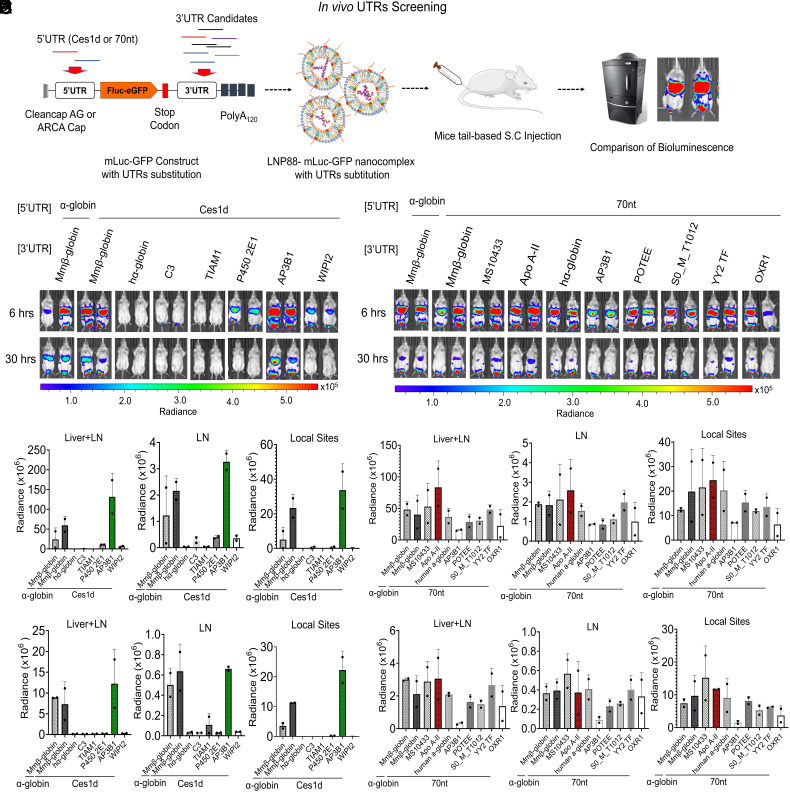
Fig. 1.
In vivo screening of UTRs via S.C. route. (A) Schematic illustration of UTR optimization in mice. In the mRNA construct, mLuc-GFP was capped with CleanCap AG or ARCA cap, tailed with 120 bases of polyadenosine (Poly A120), incorporated with N1-methylpseudouridine (m1Ψ) and fused with Ces1d or 70 nt as the 5′UTR. The 3′UTRs are substituted with UTR fragments of interest to assess their performance on mLuc-GFP translation in vivo. (B) Images of in vivo bioluminescence at 6 h and 30 h following S.C. injection of a series of mLuc-GFP constructs with Ces1d as the 5′UTR paired with different 3′UTRs in LNP88 formulation. (C) Quantification of the Fluc expression level at 6 h (a) and 30 h (b) in each organ area (Livers, LNs, and Local sites) (n = 2). (D) Images of mice bioluminescence at 6 h and 30 h following S.C. injection of a series of mLuc-GFP constructs with 70 nt as the 5′UTR paired with different 3′UTRs in LNP88 formulation. mLuc-GFP construct with SBI UTRs substitution was used as control. (E) Quantification of Fluc expression over time, 6 h (a) and 30 h (b), at the location of bioluminescence distribution in mice (Livers, LNs and Local sites) (n = 2). Unless specified otherwise, scale represents radiance (p/sec/cm2/sr) min = 4.38e4 to max = 5.58e5. Average ± SD (n = 2 mice per group), biological replicates shown.

