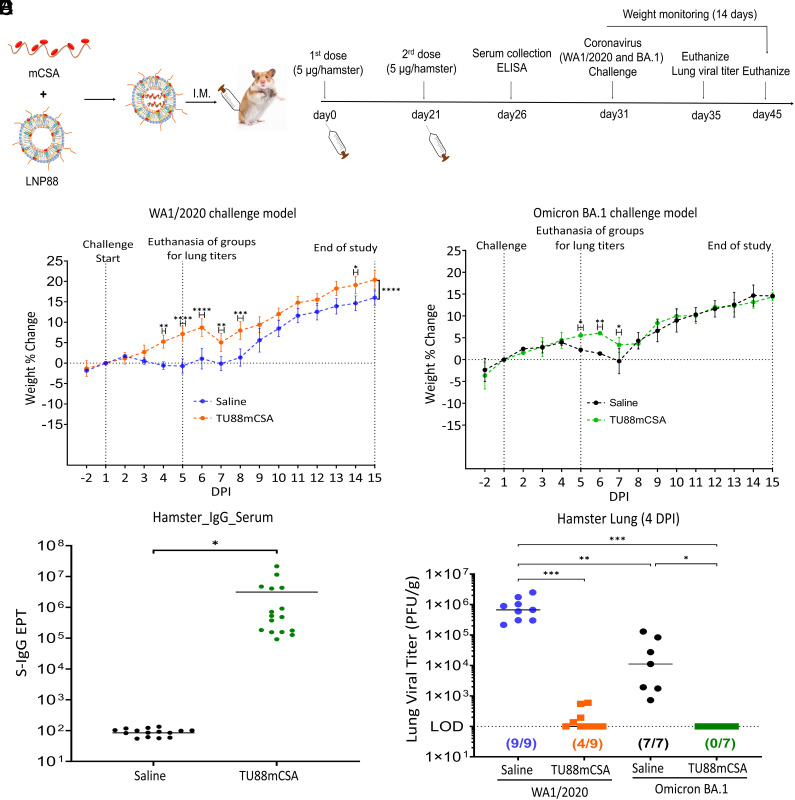
Fig. 4.
TU88mCSA protects golden Syrian hamsters from WA1/2020 and Omicron BA.1 challenge. (A) Schematic illustration of hamster experimental design. Four groups of hamsters were investigated. The first two groups were I.M. vaccinated with mock (Saline, n = 12) or TU88mCSA (5 µg, n = 12) at weeks 0 and 3, followed by SARS-CoV-2 WA1/2020 (4 × 10⁴ pfu) challenge at day 31 and viral load analysis was performed on 4 DPI (n = 4 per group) and hamster body weights were monitored for 14 d (n = 8 per group). The other two groups of hamsters (n = 4 per group) were vaccinated mock (Saline) or TU88mCSA at weeks 0 and 3, followed by I.N. challenge with SARS-CoV-2 variant Omicron BA.1 (1.3 × 10⁴ pfu) at day 31. On 4 DPI (n = 2), lung tissues (n = 2 per group) were harvested for analysis of viral titers. Hamster body weights were monitored for 14 days after Omicron BA.1 inoculation (n = 2 per group). See SI Appendix, Fig. S18 for hamster assignments to mock control and vaccinated groups. The challenge study was repeated to reproduce the data but was increasing hamsters to five for each group. The data from two challenge studies at SI Appendix, Fig. S21 were combined together in this figure. (B) Hamster body weight change (%) following WA1/2020 challenge (4.0 × 10⁴ pfu/hamster, n = 8 per group). (C) Hamster body weight change (%) after Omicron BA.1 challenge (1.3 × 10⁴ pfu/hamster, n = 2 per group). (D) SARS-CoV-2 S-specific IgG titer in hamster serum day 7 post-booster (n = 16) determined by ELISA. *P < 0.05, two-tailed t test. Average ± SD. (E) Comparison of lung viral titers in WA1/2020 or Omicron BA.1-infected hamsters with or without TU88mCSA immunization. All data from two challenge studies were combined together in the same graph. Nine hamsters per group in WA1/2020 challenge model and seven hamsters per group in Omicron BA.1 challenge model. LOD: 100 pfu/g lung. Unless specified otherwise, significance for (B) and (C) was statistically determined by two-way ANOVA Šídák's multiple comparisons test. Significance for (E) was statistically determined by the one-way ordinary ANOVA Tukey test, *P < 0.05, **P < 0.005, ***P < 0.0005, ****P < 0.0001. Average ± SD. Biological replicates shown.

