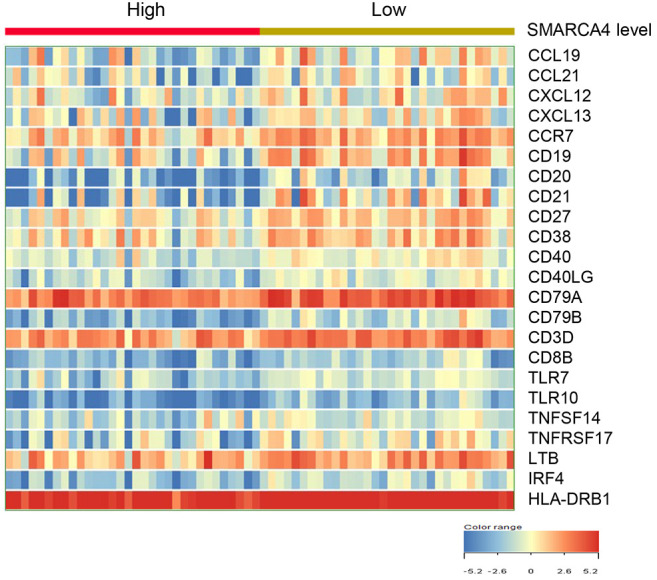
Figure 7. Comparison of the expression levels of TLS-associated 23 genes between SMARCA4-high group and -low groups in SMARCA4-mutated stomach cancers. The data are presented in matrix format, where each row represents an individual case, and each column represents a gene. The red and green colors reflect the gene expression levels, as indicated in the color scale (log2-transformed scale) in the bottom right corner.

