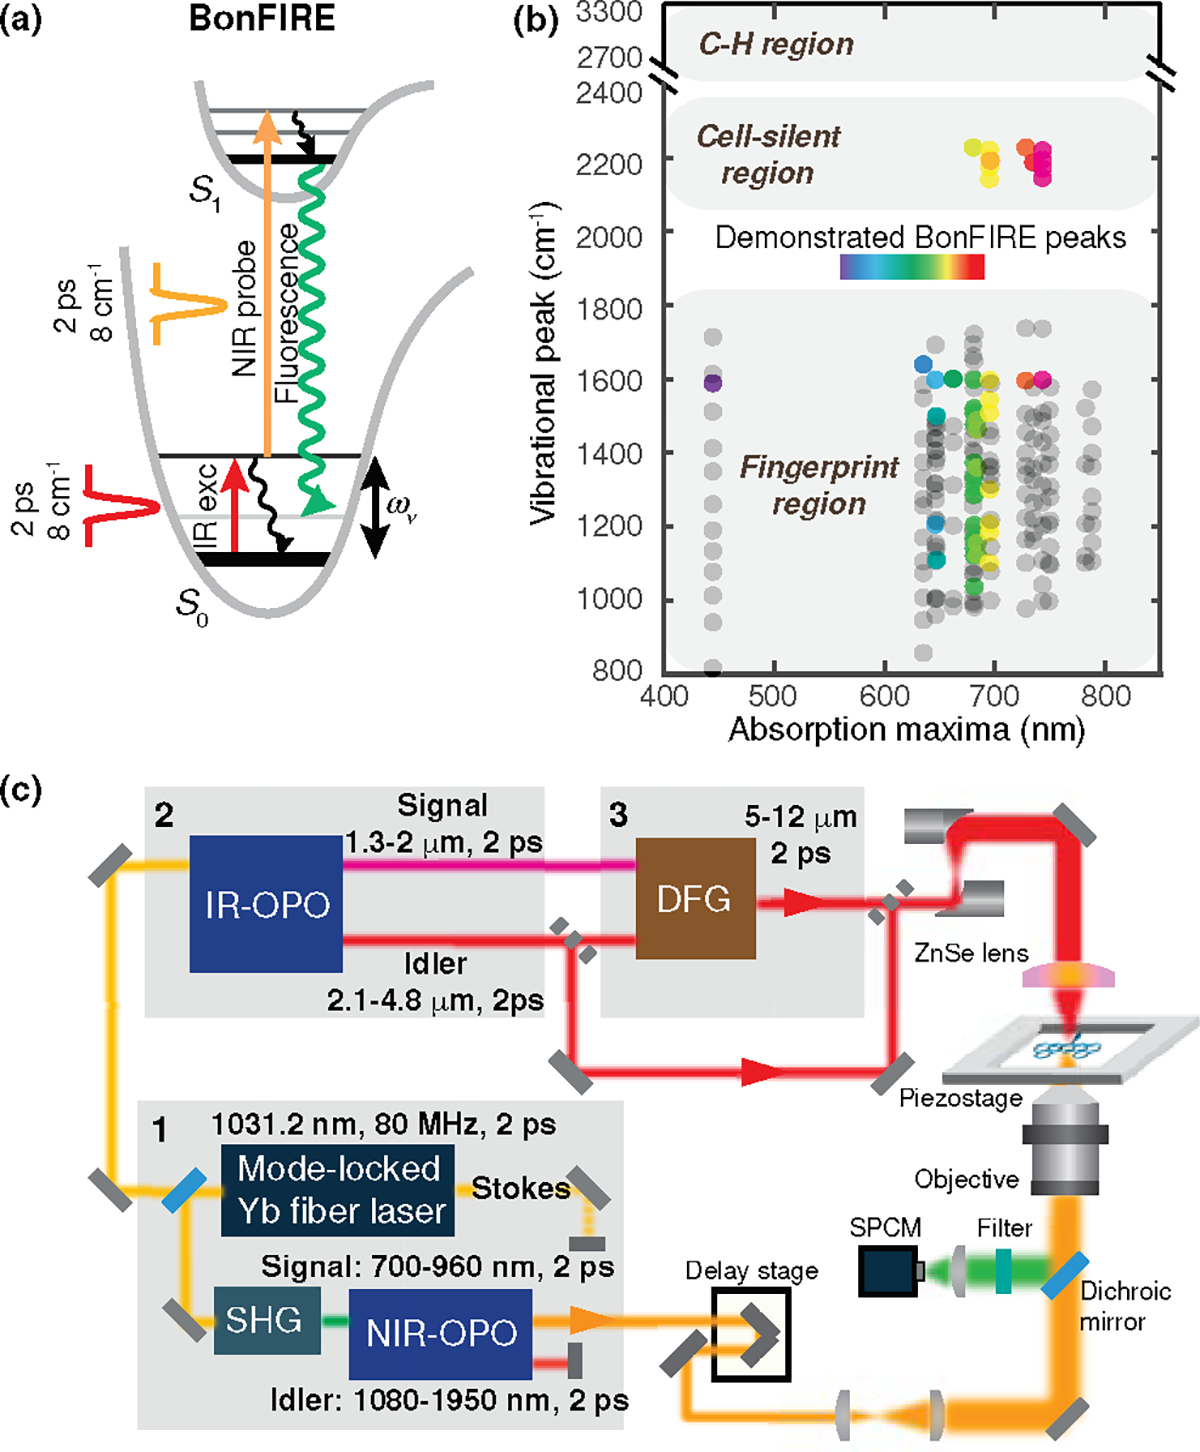
Figure 1. Principle, setup, and broad spectral coverage of BonFIRE spectro-microscopy.

(a) Energy diagram of bond-selective fluorescence-detected IR-excited (BonFIRE) spectroscopy. and : Ground and first electronic excited states. : Ground-state vibrational energy. (b) Spectral coverage of BonFIRE. Grey dots are vibrational peaks of 18 dyes measured by FTIR (see Table S1 and Extended Data Fig. 3 for details). Rainbow-coloured dots are vibrational peaks that are already detected by BonFIRE. (c) BonFIRE experimental setup. Grey rectangles indicate flip mirrors. Grey-shaded boxes labelled with numbers 1, 2, and 3 indicate three interdependent laser modules for generating coherent and tuneable 2-ps near-IR (NIR) and mid-IR pulses in BonFIRE. SHG: second-harmonic generation; OPO: optical parametric oscillator; DFG: difference frequency generation; SPCM: single-photon counting module.
