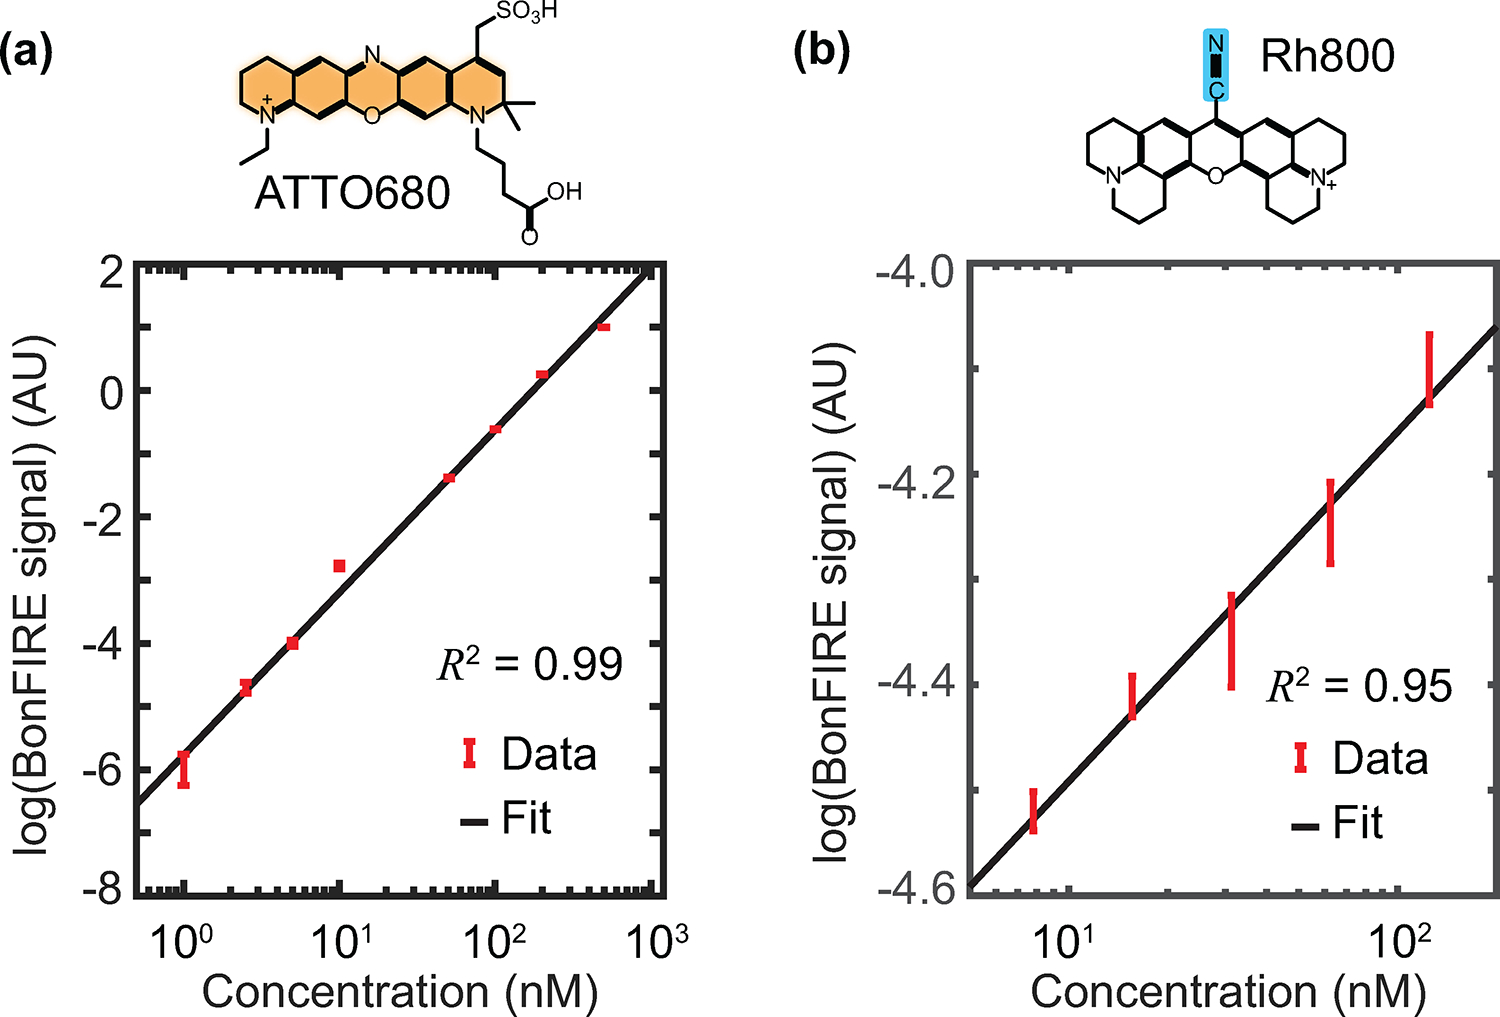
Extended Data Fig. 8. BonFIRE concentration curves with PMT AC detection.

a, The concentration curve of C = C in ATTO680 in DMSO. The lowest concentration measured is 1 nM. The probe wavelength is 765 nm, and the IR frequency is 1592 cm−1. Data are presented as peak values +/− SD from the background (n = 9). a.u., arbitrary unit. b, Concentration curve of C ≡ N in Rh800 in DMSO. The lowest concentration measured is 8 nM. The probe wavelength is 830 nm, and the IR frequency is 2228 cm−1. Both minimum concentrations are close to or below the calculated single-molecule threshold of 5 nM. Data are presented as peak values +/− s.d. from the background (n = 22).
