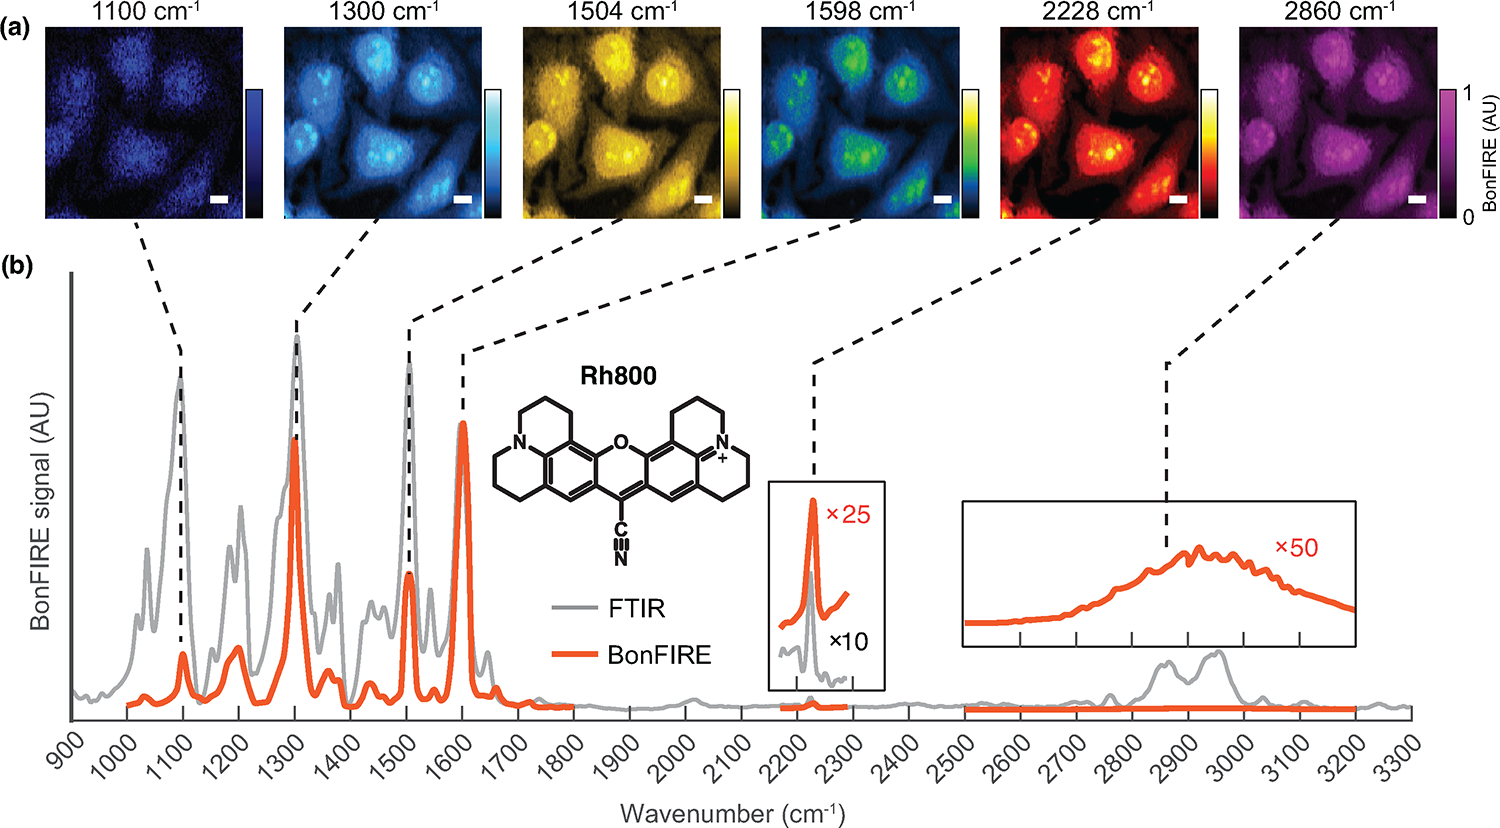
Extended Data Fig. 9. Broad spectral coverage of BonFIRE microscopy.

a, BonFIRE images of Rh800-stained HeLa cells targeting six different vibrational modes. Vibrations of phenolic C-O (1100 cm−1), aromatic C-N (1300 cm−1), conjugated C = C (1504 cm−1 and 1598 cm−1), conjugated C ≡ N (2228 cm−1), and C-H stretch (2860 cm−1) can all serve for BonFIRE imaging. a.u., arbitrary unit. Scale bars, 10 μm. b, BonFIRE spectrum (red) and FTIR spectrum (grey) of Rh800. BonFIRE spectrum is normalized to the most intense peak at 1598 cm−1. The C ≡ N peak around 2228 cm−1 and a weak broad peak of the C-H region (2700 cm−1–3200 cm−1) are enlarged in insets for better comparison.
