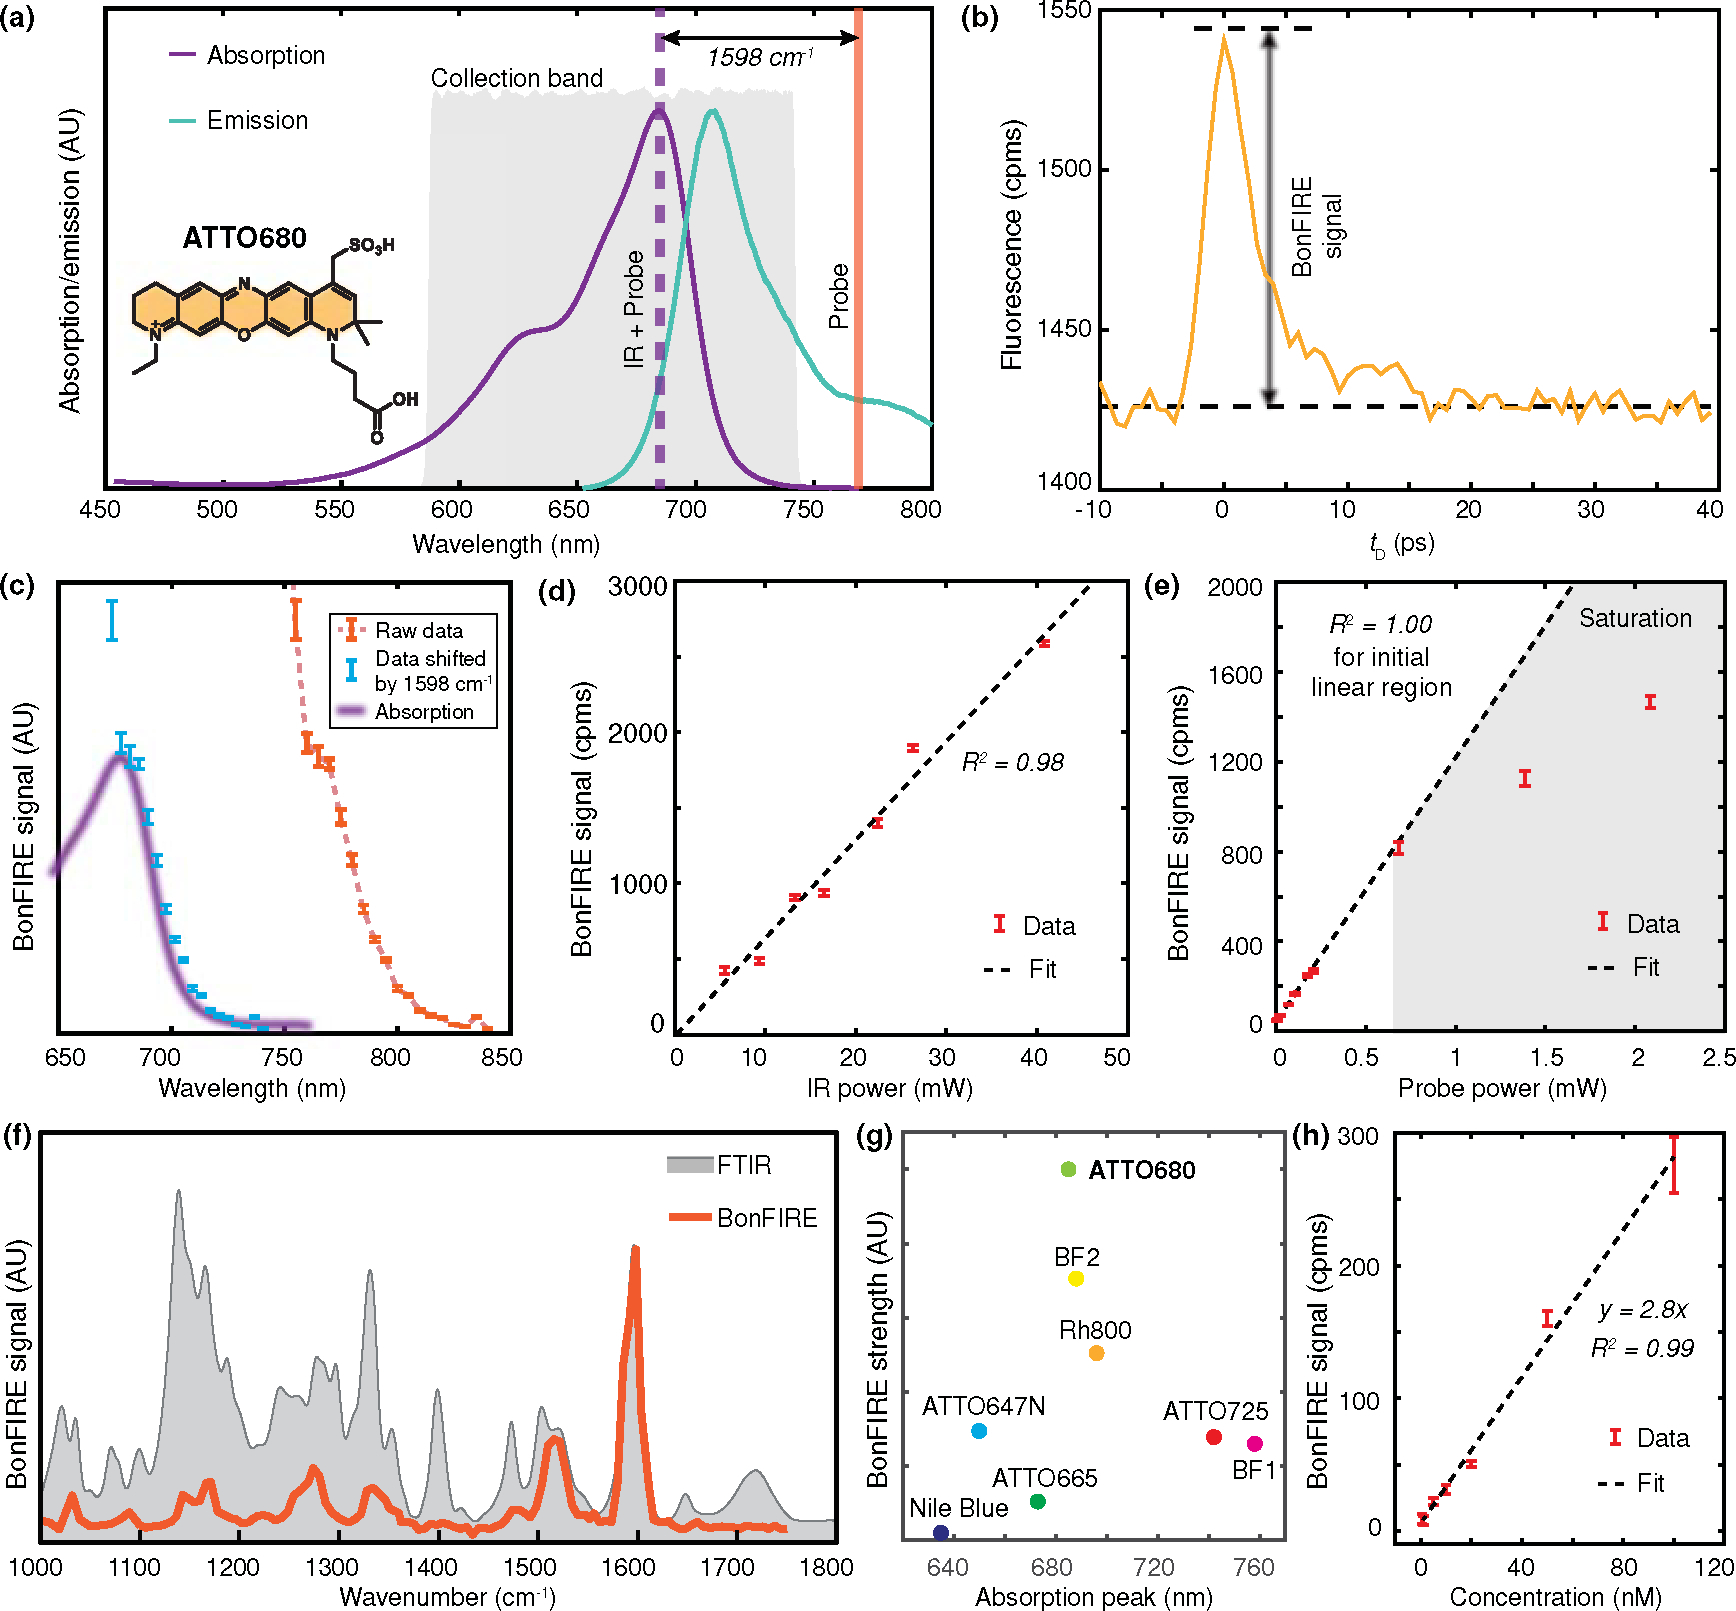
Figure 2. Double-bond BonFIRE characterizations.

(a) Fluorescence absorption/emission spectra of ATTO680 with indicated optimal BonFIRE up-conversion probe wavelength (orange) and collection band (grey), targeting the IR vibrational peak at 1598 cm−1. (b) BonFIRE signal dependence on IR-probe pulse delay. cpms: counts per millisecond. (c) BonFIRE signal dependence on probe wavelength (dashed orange). The BonFIRE excitation profile (orange dots, by horizontally shifting the raw data by adding the IR frequency of 1598 cm−1) is also overplotted with the absorption spectrum of ATTO680 (purple). Data are presented as peak values +/− SD from the background (n = 13). (d-e) BonFIRE signal dependences on IR power (d) and probe power (e) on sample, measured from 10 μM ATTO680 in DMSO. Data are presented as peak values +/− SD from the background (n = 18). (f) Overplot of BonFIRE (red) and FTIR (grey) spectra of ATTO680. (g) Comparison of BonFIRE signals among eight dyes (1 μM in DMSO), targeting the IR excitation for their corresponding C=C bonds around 1600 cm−1. Details are provided in Table S2. (h) The dependence of BonFIRE signal on the ATTO680 concentration in DMSO. A detection limit of 0.5 nM was obtained with a signal-to-noise ratio (S/N) of 3. Data are presented as mean +/− SD (n = 3).
