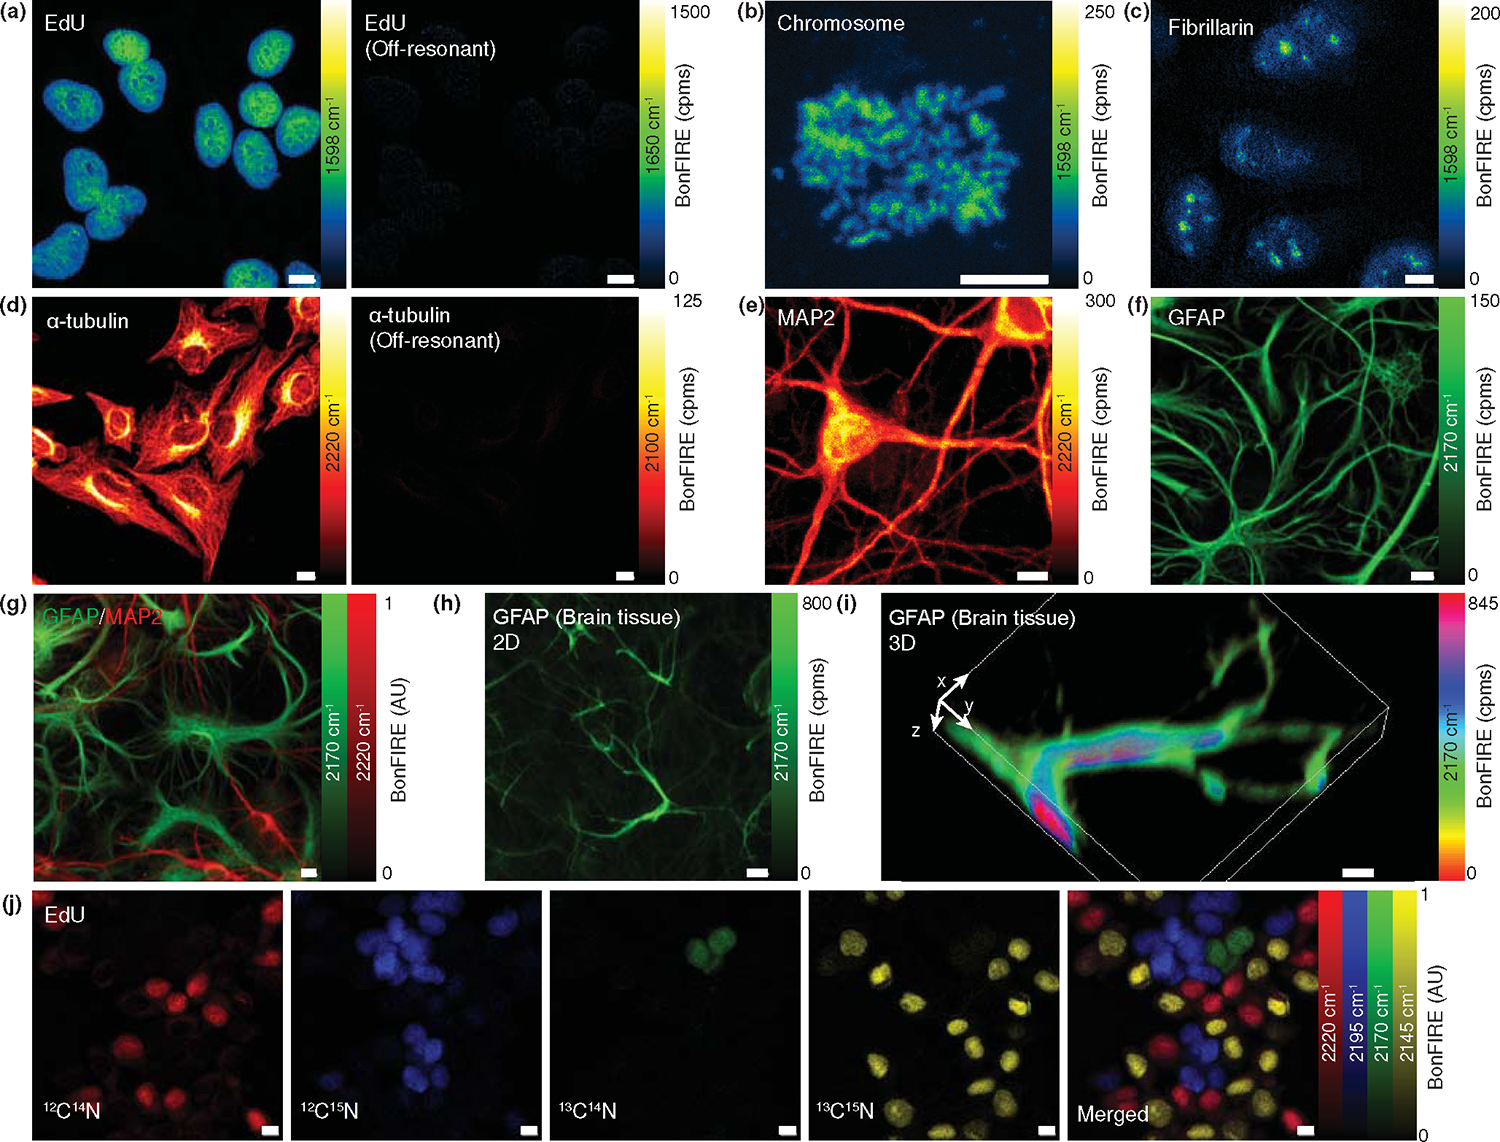
Figure 5. Bond-selective bioimaging by BonFIRE microscopy.

(a) On-resonance (left, 1598 cm−1) and off-resonance (right, 1650 cm−1) BonFIRE images of C=C vibration in ATTO680-click-labelled EdU in nuclei of HeLa cells. (b-c) BonFIRE images targeting C=C vibration in ATTO680-click-labelled EdU in extracted chromosomes (b) and ATTO680-immunolabelled-fibrillarin in nucleoli (c) from HeLa cells. (d) On-resonance (left, 2220 cm−1) and off-resonance (right, 2100 cm−1) BonFIRE images of C≡N vibrations in BF1-immunolabelled α-tubulin in HeLa cells. (e-f) BonFIRE images of 12C≡14N (2220 cm−1, e) in BF1-immunolabelled MAP2 (marker for mature neurons) and 13C≡14N (2170 cm−1, f) in BF1-isotopologue-immunolabelled GFAP (marker for astrocytes) in mouse neuronal co-cultures. (g) Two-colour BonFIRE imaging of 13C≡14N (green, 2170 cm−1) and 12C≡14N (red, 2220 cm−1) in BF1- and BF1-isotopologue-immunolabelled GFAP and MAP2 from the same set of neuronal co-culture. (h-i) 2D (h) and 3D rendering (i) BonFIRE images of BF1-13C≡14N-immunolabelled GFAP in a mouse brain tissue slice. (j) Four-colour BonFIRE images of 12C≡14N (red, 2220 cm−1), 12C≡15N (blue, 2195 cm−1), 13C≡14N (green, 2170 cm−1), and 13C≡15N (yellow, 2145 cm−1) BF1-isotopologue-click-labelled EdU in nuclei of HeLa cells. The merged image is shown to the right. Cpms: counts per millisecond. Scale bars: 10 μm.
