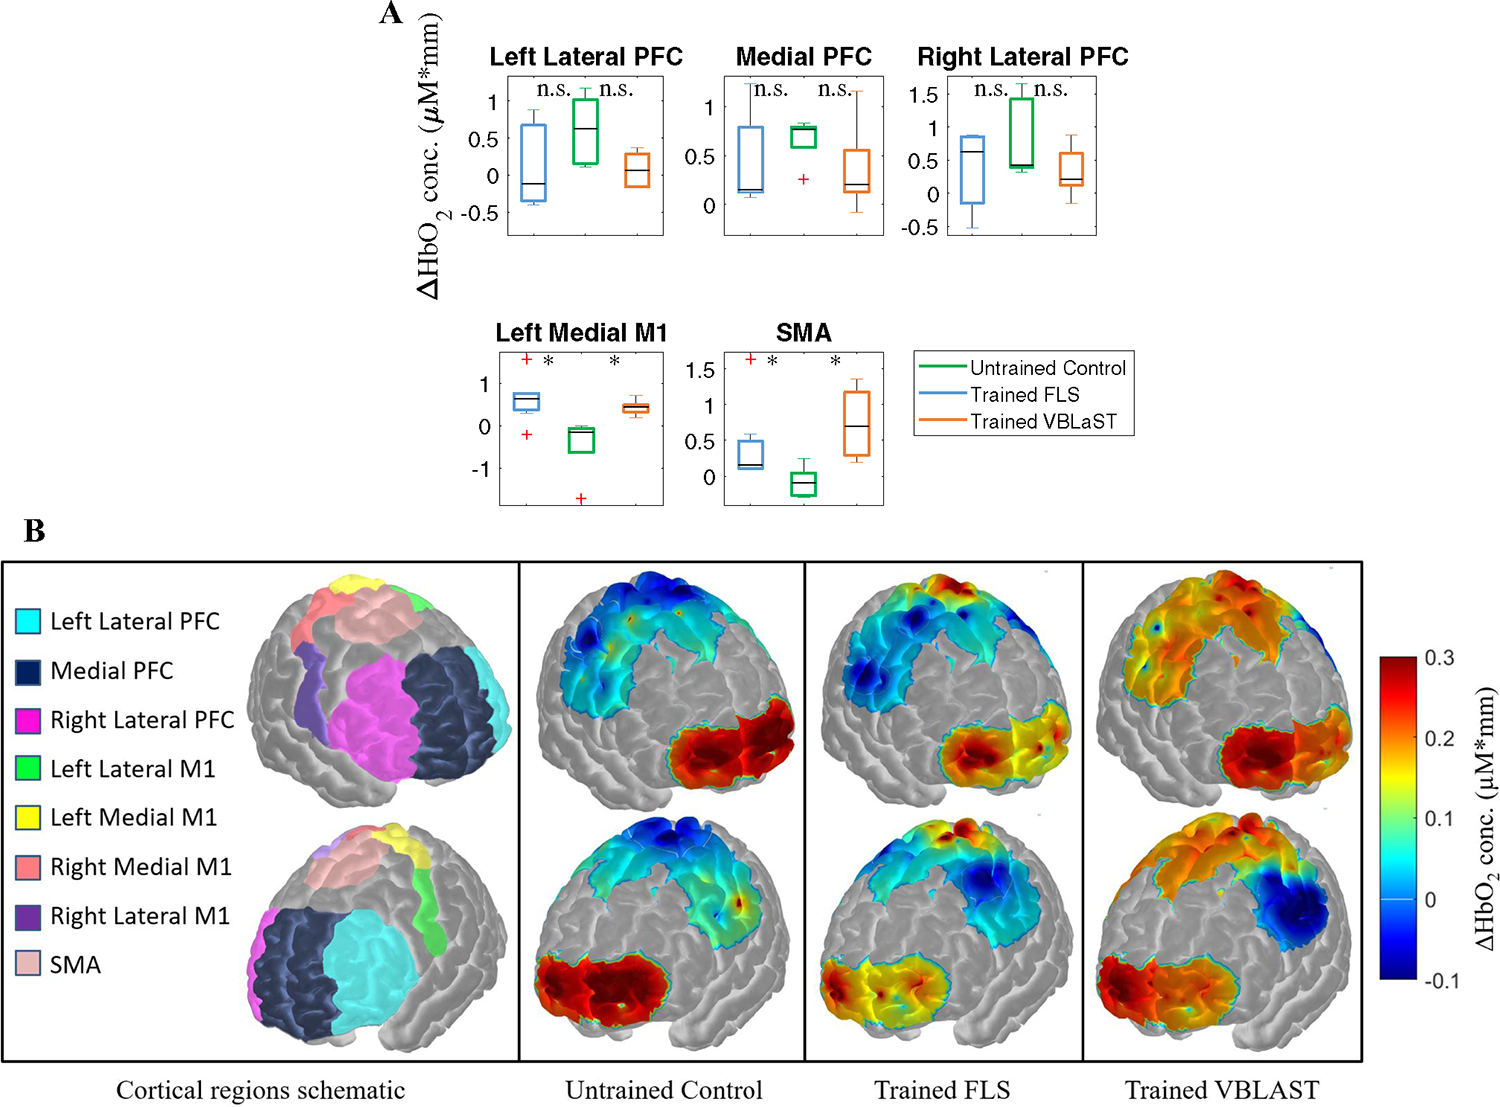
Fig. 3.

Changes in cortical activation during the transfer task with respect to cortical regions. A Average changes in hemoglobin (ΔHbO2) concentration as a measure of functional activation with respect to different cortical regions for FLS trained subjects (magenta), untrained control subjects (cyan), and VBLaST trained subjects (black) while all subjects perform the ex-vivo transfer task. B Spatial maps of functional activation with respect to varying degrees of training levels during the ex-vivo transfer task. Spatial maps cover specific regions including the PFC, M1, and SMA for all subjects. (Color figure online)
