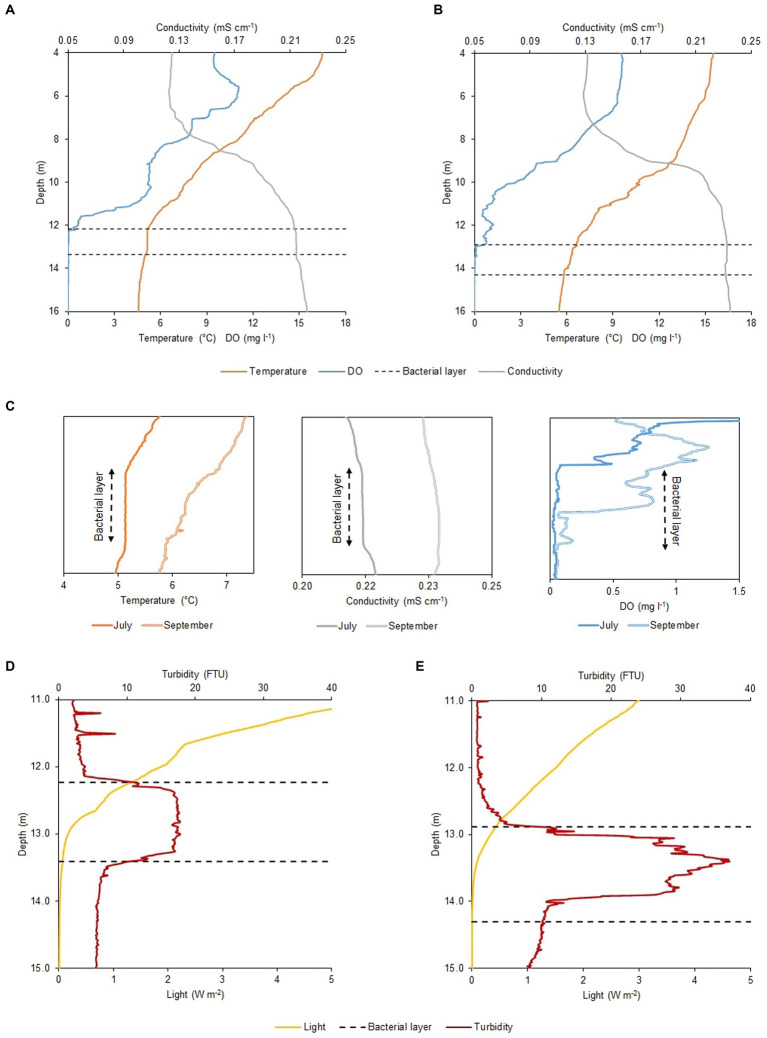
Figure 1.
Physicochemical profiles of Lake Cadagno water column. CTD profiles of oxygen (mg l−1), temperature (°C), and temperature-corrected (20°C) conductivity (mS cm−1) in (A) July and (B) September. (C) Temperature (left), temperature-corrected conductivity (central) and DO (right) microstructure profiles for the BL and adjacent regions observed on the two different moments of the year 2020. Different light irradiance (W m−2) and turbidity (FTU) values within the BL observed between (D) July and (E) September. Black dashed lines indicate the BL position on both sampling days (16 July and 17 September 2020).

