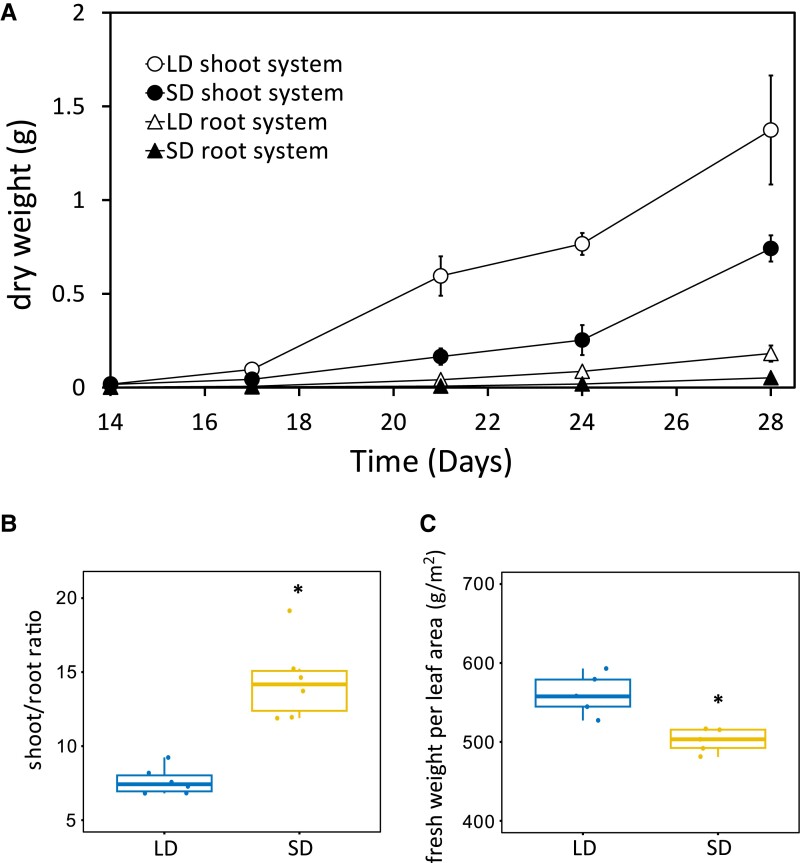
Figure 1.
The effect of daylength on plant growth and leaf properties. A) The DW of the shoot and root system from 14 to 28 d (n = 6, ±Sd). B) Shoot/root mass ratio at 28 d (n = 6). C) Fresh weight per leaf area (n = 5). The line in the middle of the boxplots is the median. The bottom and top of the boxplot are at the 25th and 75th percentiles, respectively. The whiskers extend from the boxes and mark the 5th and 95th percentiles. Individual data points are symbolized by circles. Significant differences between LD and SD in B) and C) are marked with asterisks (Student's t-test, *P ≤ 0.05).

