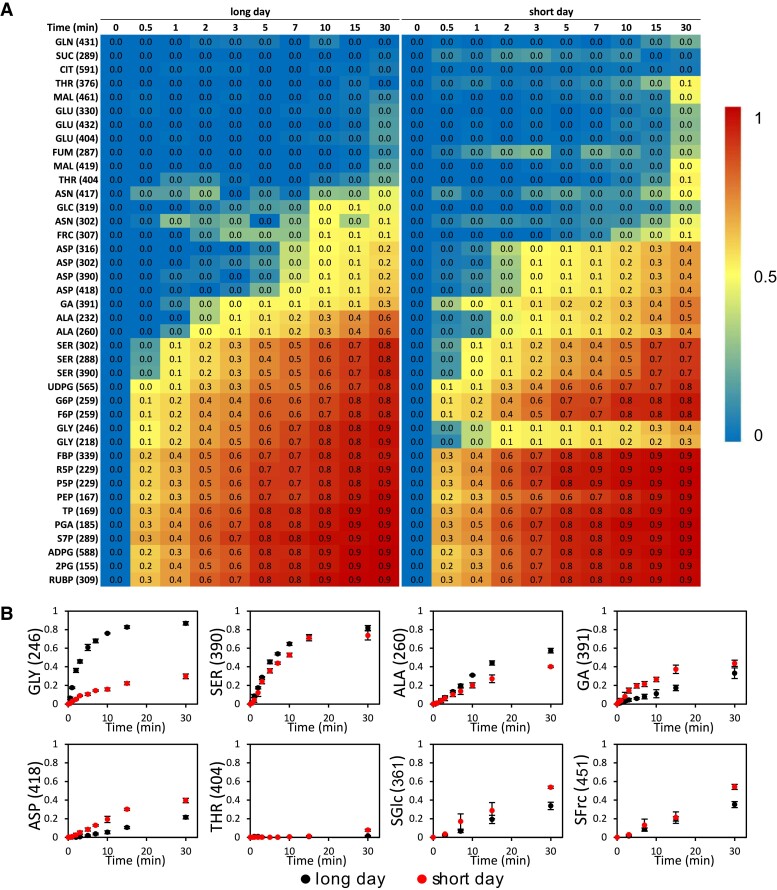
Figure 2.
13C enrichment of measured metabolites in LD and SD conditions. A) Heatmap of 13C enrichment of metabolites from 0 to 30 min. The gradient bar represented the value of 13C enrichment from low to high. B)13C enrichment (n = 3, ±Sd) of glycine, serine, alanine, glycerate, aspartate, threonine, sucrose glucosyl moiety (SGlc), and sucrose fructosyl (SFrc) moiety from 0 to 30 min. The x axis represents the time of labeling (in minutes), while the y axis represents the fraction of 13C enrichment.

