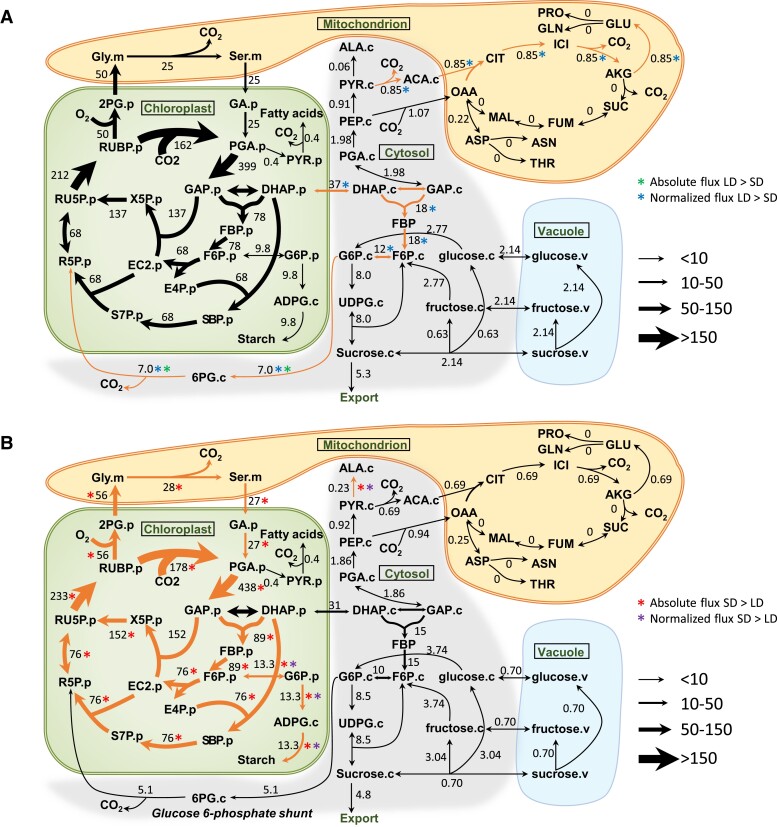
Figure 3.
Central carbon metabolic fluxes in photosynthetic C. sativa leaves in LD and SD. A) Metabolic flux map in LD conditions. B) Metabolic flux map in SD conditions. Fluxes are shown as numbers and depicted by the variable width of arrows. Both absolute and normalized fluxes were compared by 95% confidence intervals between LD and SD (Supplemental Table S5). Absolute and normalized fluxes that are bigger in LD plants are marked by green asterisk (*) and blue asterisk (*), respectively. Absolute and normalized fluxes that are bigger in SD plants are marked by red asterisk (*) and purple asterisk (*), respectively. Flux differences are highlighted by orange arrows. Flux units are expressed as µmol metabolite g−1. FW h−1. The model network is compartmentalized into cytosol (“.c”), chloroplast (“.p”), mitochondrion (“.m”), and vacuole (“.v”). 2PG, 2-phosphoglycolate; ACA, acetyl-CoA; AKG, α-ketoglutarate; ALA, alanine; ASN, asparagine; ASP, aspartate; CIT, citrate; DHAP, dihydroxyacetone phosphate; EC2, transketolase-bound-2-carbon-fragment; FBP, fructose-1,6-bisphosphatase; FUM, fumarate; GA glycerate; GLN, glutamine; GLY, glycine; ICI, isocitrate; MAL, malate; PEP, phosphoenolpyruvate; PYR, pyruvate; RU5P, ribulose-5-phosphate; RUBP, ribulose-1,5-bisophosphate; S7P, sedoeheptulose-7-phosphate; SBP, sedoheptulose-1,7-bisophosphate; SER, serine; SUC, succinate; THR, threonine. All abbreviations are shown in Supplemental Table S10.

