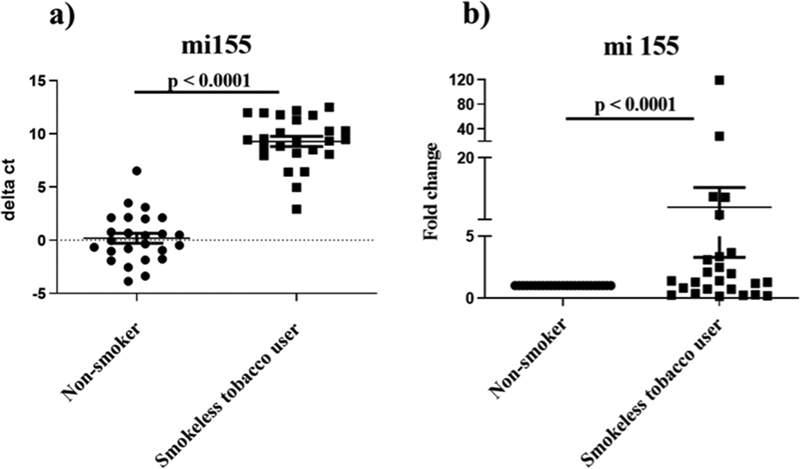
Fig 1.

Expression of miR-155 in saliva samples of smokeless tobacco (SLT) users in comparison to nonusers of smoke/smokeless tobacco. ( A ) Plot representing the delta cycle threshold (Ct) comparing the miR-155 expression in SLT users compared to nontobacco using controls. Horizontal bars represent the mean and range of the delta Ct for all the samples. ( B ) Fold change in expression of miR155 among SLT users compared to nontobacco using controls.
