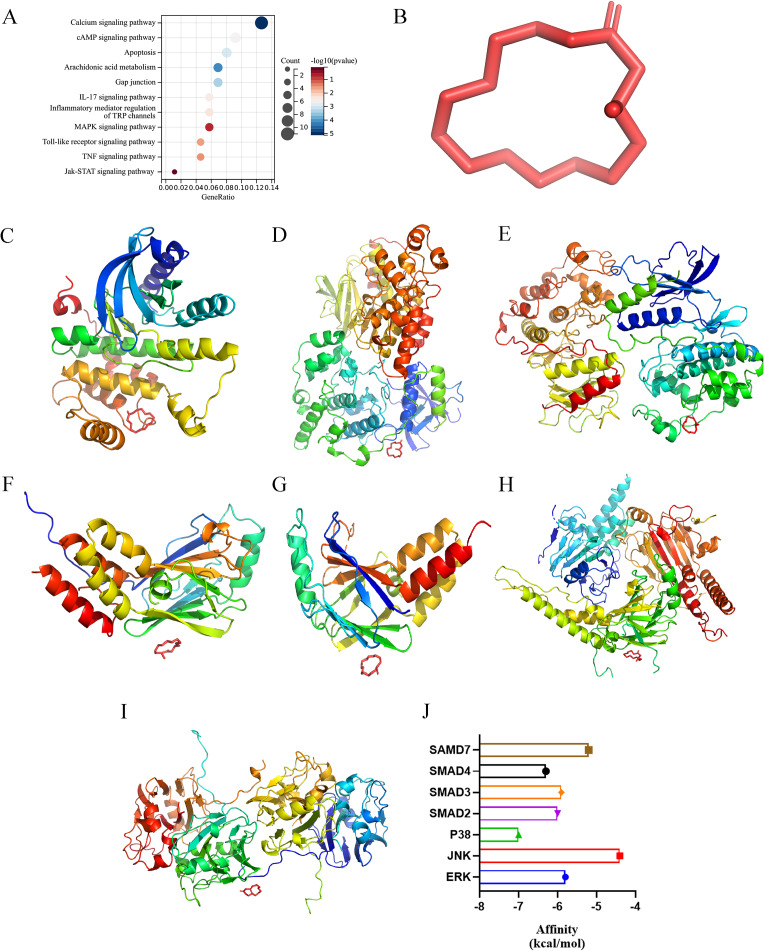
Fig. 3.
Network pharmacological analysis and molecular docking. (A) KEGG enrichment analysis of the potential binding target proteins. (B) Molecular 3D structure of muscone. (C-I) For the 3D structures of the individual protein molecules, the muscone molecule is shown in red, and the other molecules (ERK, JNK, P38, SMAD2, SMAD3, SMAD4, and SMAD7) are shown in different colors. (J) The bar chart shows the affinity of muscone for each molecule

