FIGURE 2.
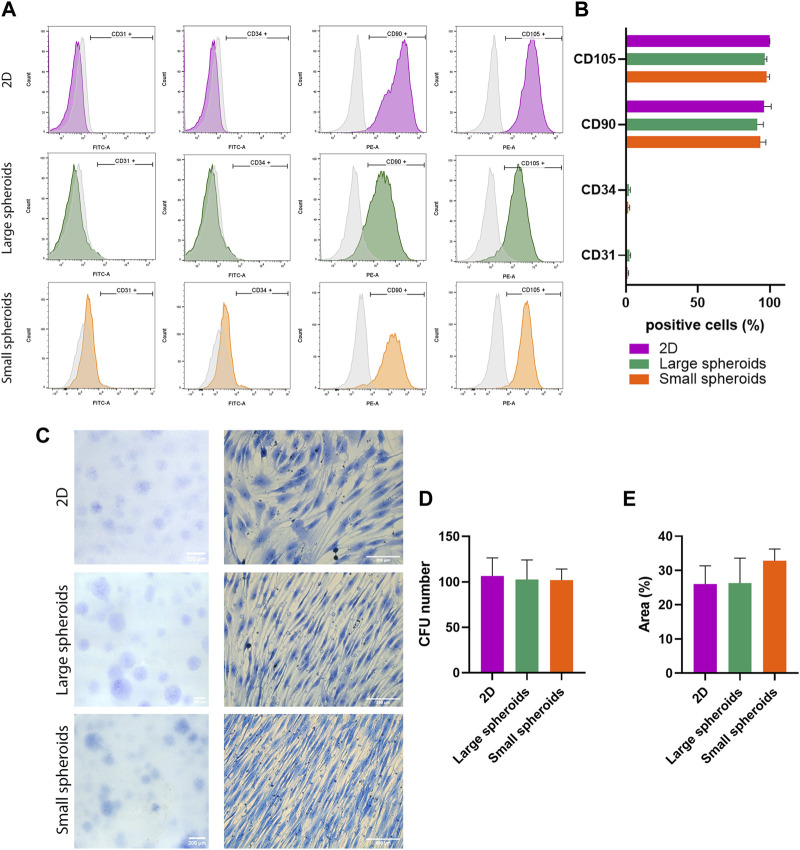
MSC phenotype and self-renewal ability evaluation. (A) Representative histograms reporting flow cytometry analysis of MSCs cultured in 2D (purple), large (green), or small (orange) spheroids. Histogram curves identify cells reacting with CD31-, CD34-, CD90-, and CD105-specific antibodies. Area under the gray curve identifies the reaction of the cells with the correspondent non-reactive immunoglobulin of the same isotype (isotype control). Data are representative of three independent experiments. (B) Flow cytometry analysis of MSCs cultured in 2D, large, or small spheroids. Histogram shows the average percentage of positive events for each marker. Data are represented as the mean ± SD (N = 3). (C) Representative images of CFU-f (left) and a magnification showing the colony cell morphology (right); scale bar = 200 µm. (D) Number of colonies and (E) area of the Petri dish occupied by colonies of MSCs derived from 2D, large, and small spheroid cultures. Data are represented as the mean ± SD (N = 3).

