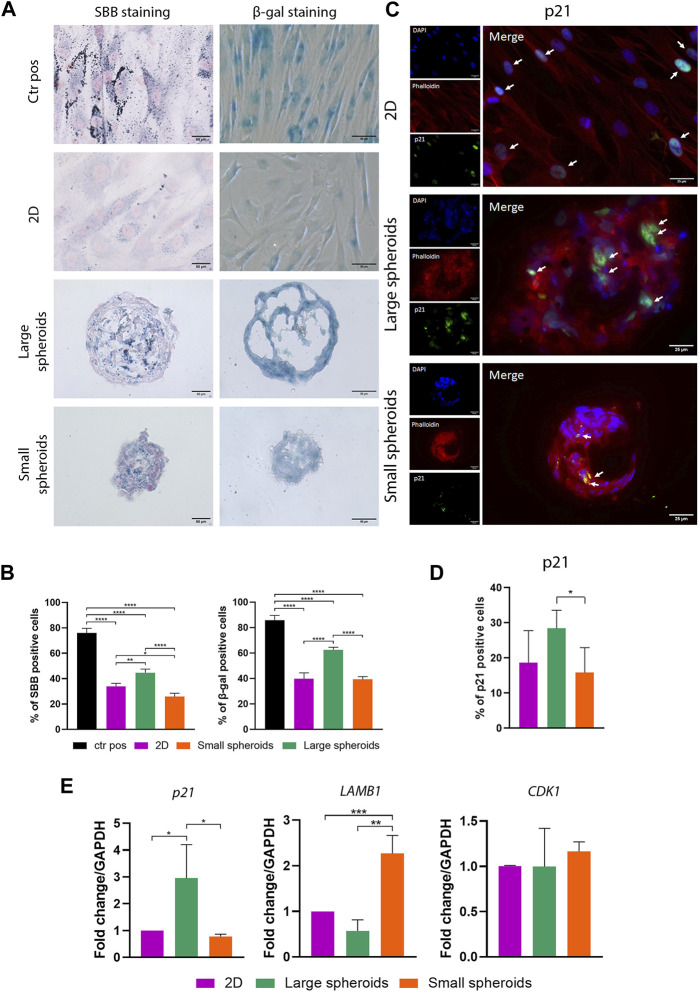
FIGURE 4.
Spheroid culture influences cellular senescence in MSCs. (A) Representative images of Sudan black B and β-galactosidase staining of the different culture conditions; scale bar = 50 µm. Ctr pos, positive control. (B) Quantification of SBB- and β-galactosidase-positive cells. SBB- and β-galactosidase-positive cells have been counted considering 10 different regions of interest for each replicate with a mean diameter of 338.14 ± 19.62 µm for large spheroids and 187.43 ± 13.26 µm for small spheroids. Data are represented as the mean ± SD. * p-value <0.05, ** p-value <0.01, and **** p-value <0.0001 (N = 4, one-way ANOVA). (C) Representative images of immunostaining for p21 on different culture conditions. From the top, pictures show the nuclei (DAPI), phalloidin, p21, and their merge view; scale bar = 25 µm. (D) Quantification of p21-positive cells on immunostaining. Positive cells have been counted considering 10 different regions of interest for each replicate, with a mean diameter of 332.12 ± 18.40 µm for large spheroids and 193.35 ± 7.22 µm for small spheroids. (E) Quantitative real-time PCR for the expression of p21, LAMB1 (lamin subunit beta 1), and CDK1 (cyclin-dependent kinase 1); data are represented as the mean ± SD. * p-value <0.05, ** p-value <0.01, and *** p-value <0.001 (N = 3, one-way ANOVA).

