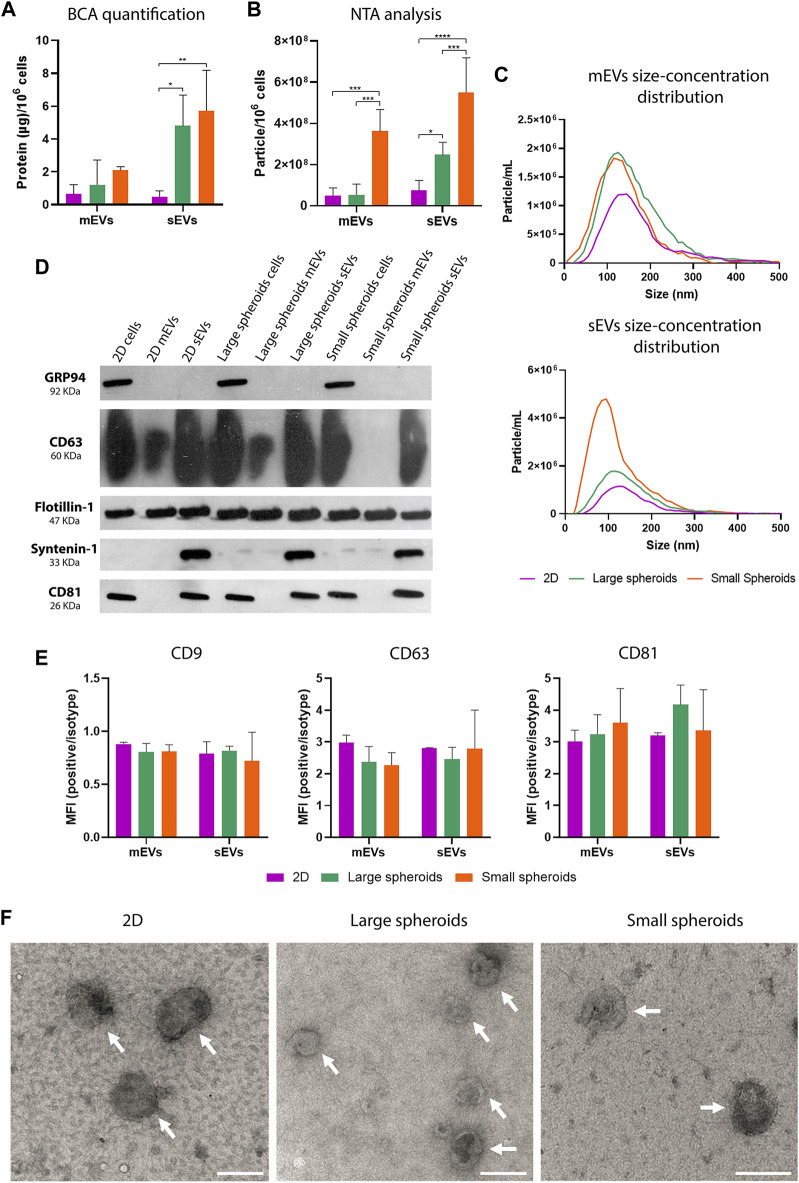
FIGURE 6.
MSC spheroids secrete higher quantity of EVs compared to 2D. (A) Quantification of protein content on mEVs and sEVs using the BCA assay; data are normalized to the cell number (µg/106 cells). Data are represented as the mean ± SD; * p-value <0.05 and ** p-value <0.01 (N = 4, two-way ANOVA and Tukey’s multiple comparison). (B) NTA of particle concentration, expressed as particle/106 cells. Data are represented as the mean ± SD; * p-value <0.05, *** p-value <0.001, and **** p-value <0.0001 (N = 4, two-way ANOVA and Tukey’s multiple comparison). (C) Representative NTA size distribution analysis of mEVs and sEVs (N = 4). (D) Western blot analysis on 2D, large, and small spheroid MSC culture-derived mEVs and sEVs; cell lysates were also loaded as controls. Specific expression of CD63, CD81, flotillin-1, syntenin-1, and GRP94 was investigated. (E) Quantification on flow cytometry analysis of CD9-, CD63-, and CD81-positive events in the CFDA-SE gate. Data are shown as ratio between mean fluorescence intensity (MFI) of EVs stained with specific antibody and the correspondent isotype control (relative MFI) (N = 3). (F) TEM micrographs of isolated mEVs and sEVs. Scale bar = 200 nm. White arrows indicate EVs.

