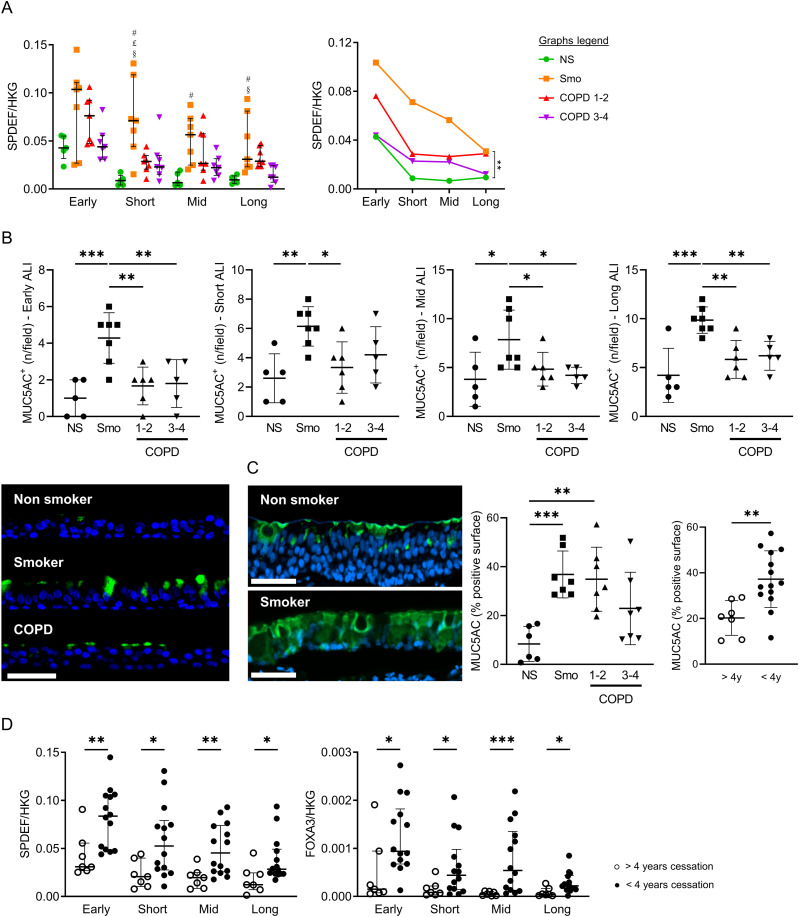
Figure 4. Altered differentiation programming towards goblet cells in Smo and COPD patients.
(A) Increased SPDEF expression in Smo AE as compared with NS in short-term, mid-term, and long-term ALI culture, as depicted for each timepoint (left graph) and in a longitudinal analysis (right graph, significance bar: Smo versus NS). Of note, error bars were not added on the longitudinal data for reasons of readability. #, £, and § highlight significant decreases in NS, COPD1-2, and COPD3-4 patients, respectively, as compared with NS. (B) Increased MUC5AC-positive goblet cells in Smo AE as compared with NS and COPD patients in early, short-term, mid-term, and long-term ALI culture. Bottom left picture: illustrative TSA immunofluorescence staining for MUC5AC, showing increased positive goblet cells in ALI cultures (here, in mid-term ALI-AE) from Smo as compared with NS and COPD. (C) In situ, in bronchial surgical sections, MUC5AC-positive surface is increased in Smo AE as compared with NS and COPD. In addition, MUC5A positive surface is significantly higher in patients who quit smoking for less than 4 yr (plain dots) as compared with long-quitters (hollow dots). (D) At every time period, SPDEF (left graph) and FOXA3 (right graph) mRNA levels are decreased in ALI-AE from Smo who quit smoking for more than 4 yr (plain dots) as compared with long quitters (hollow dots). *, **, *** indicate P-values of less than 0.05, 0.01, 0.001, and 0.0001. Bars indicate means ± SD (A, B, C) or medians ± interquartile ranges (D). AE, airway epithelium; ALI, air-liquid interface; COPD, chronic obstructive pulmonary disease; CT, control; FEV1, forced expired volume in 1 s; HKG, housekeeping genes; NS, non-smokers; SEM, standard error of the mean; Smo, smokers; y, years. Scale bar, 50 μm.

