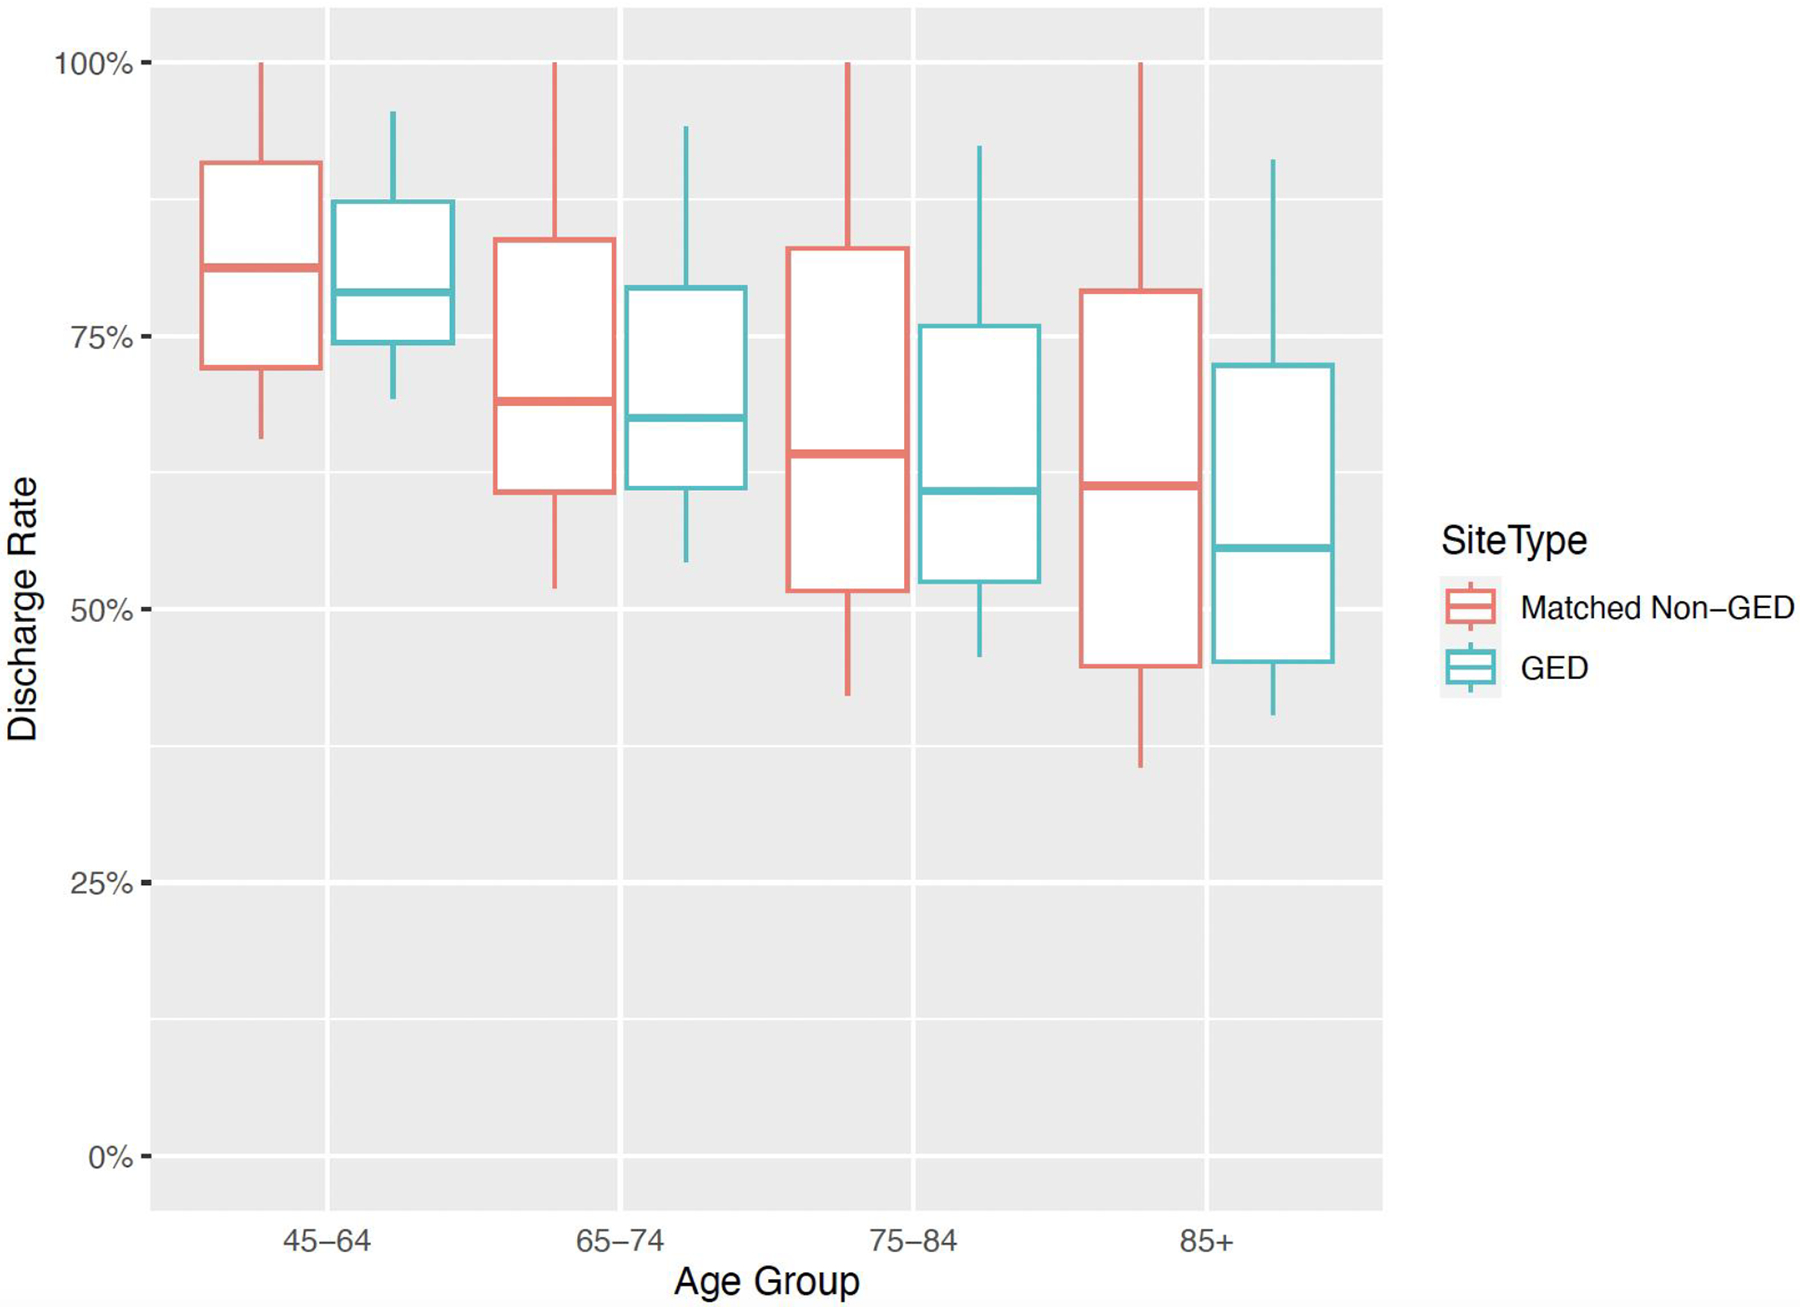
Figure 1.

Emergency department discharge rates within geriatric and non-geriatric EDs
Note – Discharge rates were assessed at the ED site-level.
Note - The box plots depict median (thick horizontal line) discharge rates with 25th and 75th percentiles for each box, while vertical lines provide the range (from minimum to maximum).
