
Supporting Figure S3.
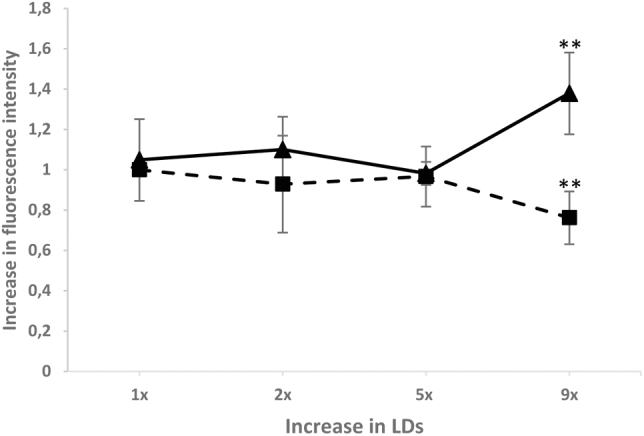
The fluorescence of ATP3-GFP at either mitochondria or LDs is shown after mixing and separation of both organelles. The dashed line represents mitochondria, the continuous line LDs. The x-axis represents increasing amounts of LDs (e.g., 9 x is a 9-fold excess of LDs).