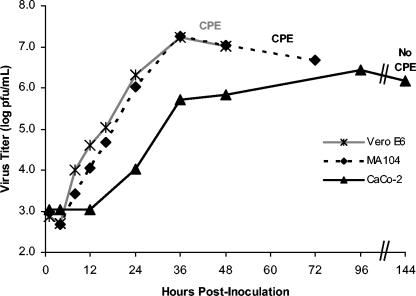
FIG. 1.
Multistep growth curves for SARS-CoV in Vero E6, MA104, and CaCo-2 cells. Confluent cell monolayers were infected at low multiplicity (MOI = 0.001 to 0.005). The appearance of CPE in Vero E6 and MA104 cells is indicated. Confluent CPE is indicated by termination of the time course. CaCo-2 cells did not exhibit CPE.

