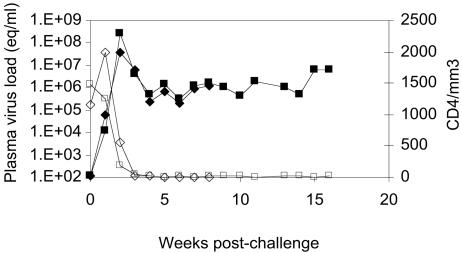
FIG. 4.
Plasma viral RNA concentration and CD4+-T-cell counts in control macaques inoculated with SHIV89.P. CD4+-T-cell values (open symbols) are presented as counts (equivalents [eq] per microliter of blood), and viral RNA concentrations are presented as copy numbers per ml of plasma (closed symbols) on the y axes, and time points are given as weeks postinoculation on the x axis of the graph. In both control animals, CD4+-T-cell counts dropped below 25 cells/μl by week three postinoculation and never recovered. Plasma viral RNA concentrations peaked at week 3 and remained >105 copies/ml throughout the study period.

