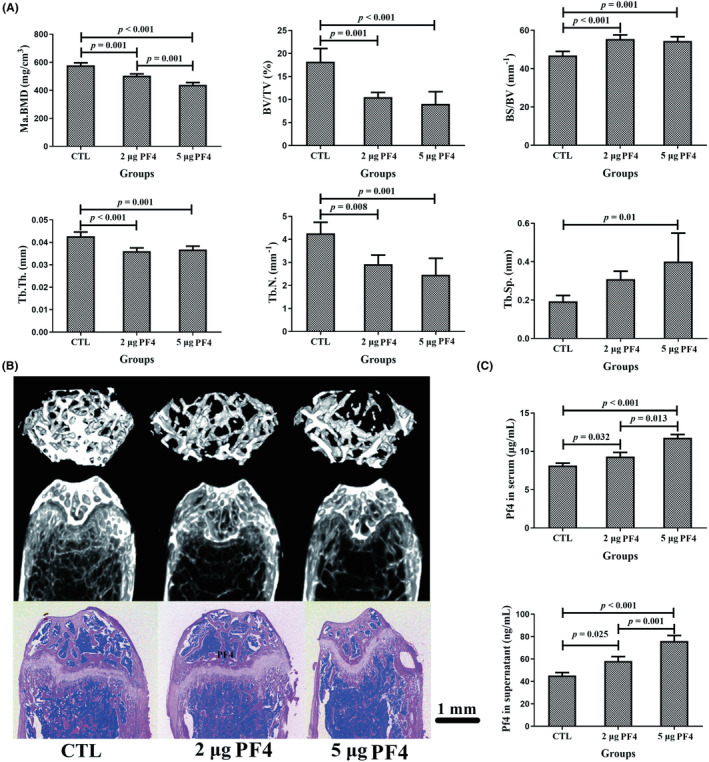
FIGURE 4.

PF4 supplementation triggered bone loss in the mice at 8 weeks. (A) BMD and bone histomorphometry of the femurs in mice at 8 weeks after an injection of different doses of PF4 in three groups. In short, the BMD and bone microarchitecture of the femur decreased with increasing doses of PF4 injection. (B) Representative images of femurs reconstructed using microCT (horizontal and coronal planes) and slicing stained with H&E (coronal plane) at 8 weeks after PF4 injection in the three groups. Scale bar = 1 mm. (C) The level of PF4 in the serum and bone marrow (BM) at 8 weeks after PF4 injection in the three groups. N = 10 mice per group. Data are expressed as the mean ± SD (standard deviation). BS/BV, bone surface area/bone volume; BV/TV, bone volume/total volume; H&E, hematoxylin and eosin; Ma. BMD, bone mineral density of BM; PF4, platelet factor 4; Tb. N, trabecular number; Tb. Sp, trabecular separation; Tb. Th, trabecular thickness.
