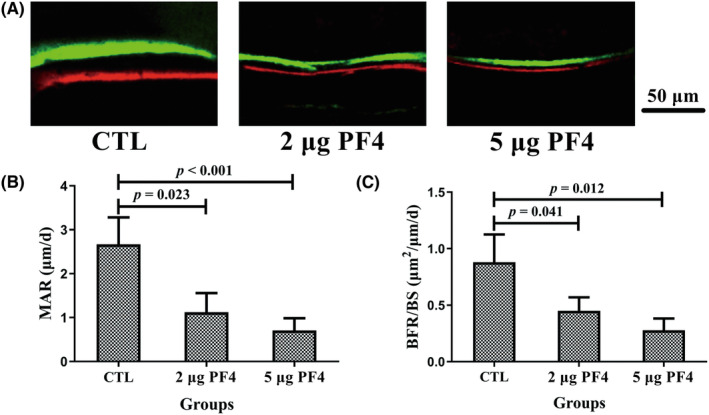
FIGURE 5.

Supplementation with PF4 decreased the BFR in mice at 8 weeks. (A) Representative fluorescence images from undecalcified bone slicing of the femur after double labeling with calcein (green fluorescence band) and alizarin‐3‐methyliminodiacetic acid (red fluorescence band). The green and red fluorescence bands represent the new bone formation area on the 10th and 3rd days prior to euthanasia, respectively, and the interval of two fluorescence bands represents the BFR between 7 days. Scale bar = 50 μm. The increased area and interval of two fluorescence bands represented better bone formation ability. (B) MAR and (C) BFR/BS were evaluated in fluorescence images from undecalcified bone slicing of the femur using Bioquant software. N = 10 mice per group. Data are expressed as the mean ± standard deviation (SD). BFR/BS, bone formation rate/bone surface; MAR, mineral apposition rate; PF4, platelet factor 4.
