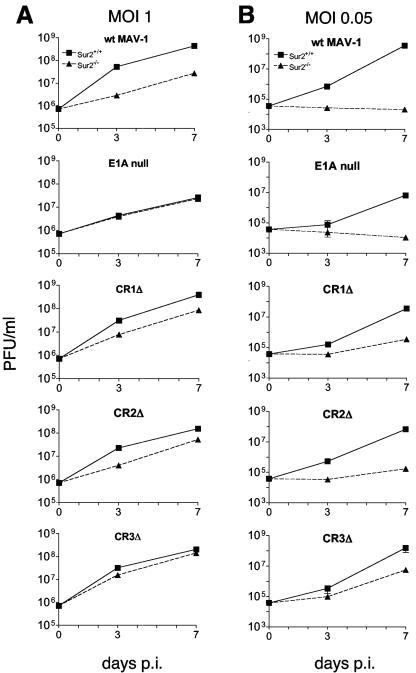
FIG. 2.
Growth of MAV-1 E1A mutant viruses in Sur2+/+ and Sur2−/− MEFs. The indicated cell types were infected with wt MAV-1, E1A null mutant, CR1Δ, CR2Δ, or CR3Δ at an MOI of 1 (A) or 0.05 (B) and harvested at the indicated times. The viral yields were determined by plaque assays of 37.1 cells. The legend for Sur2+/+ MEFs and Sur2−/− MEFs is shown at the top and is the same for all panels. The experiments were reproduced two additional times. Error bars are only distinguishable in a few samples (e.g., CR3Δ, MOI 0.05); other error bars were too small to be visualized.

