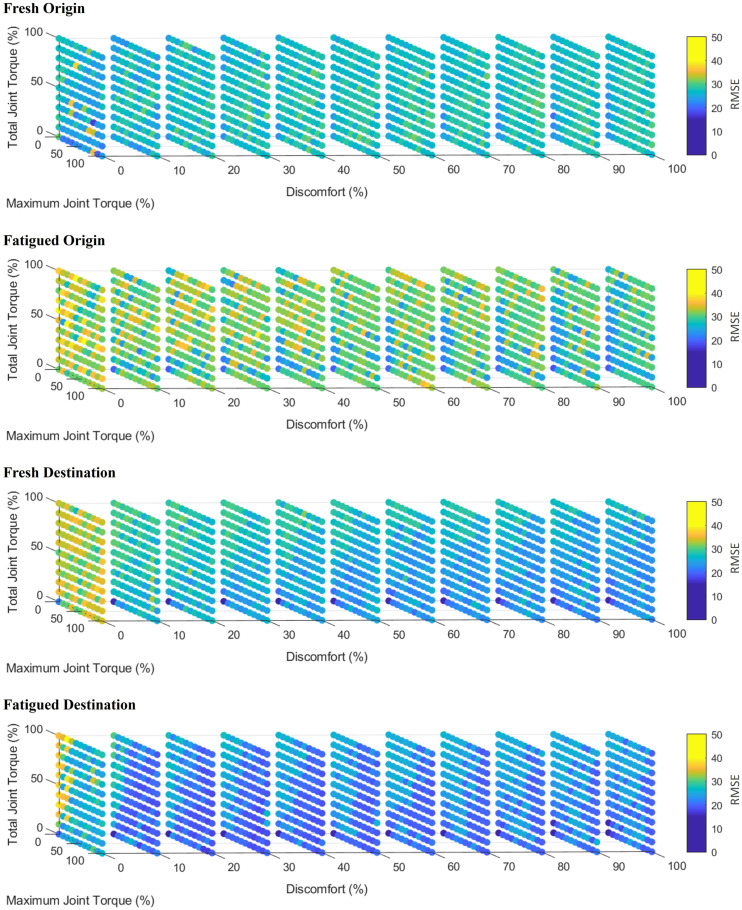
Figure 5.
Normalized RMSE response for participant 3. Each axis represents a respective objective function weighting within the multi-objective optimization model. The colour bar corresponds to the normalized RMSE calculated at each objective function weighting where dark blue represents the lowest error and dark red represents the highest error.

