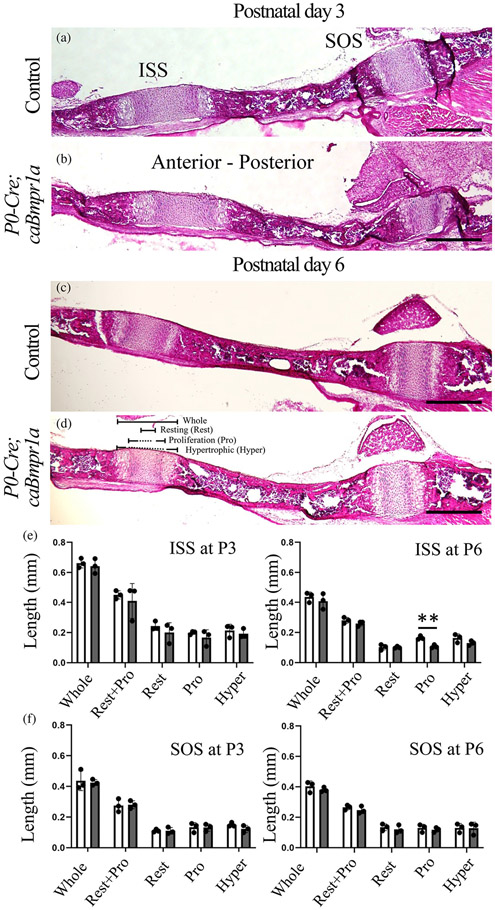
FIGURE 2.
Histological observations of intersphenoidal synchondrosis (ISS) and sphenooccipital synchondrosis (SOS) for control and P0-Cre;caBmpr1a mice at neonatal stage. (a–d) Histological sections of the ISS and SOS at postnatal day 3 (P3) and P6 were stained with hematoxylin and eosin staining. (e, f) Length between control (white bars) and P0-Cre;caBmpr1a (gray bars) at P3 and P6 were measured (n = 3, two replicate experiments were performed independently). Whole; whole synchondrosis, Resting; cells in resting zone, Pro; proliferating cells, Hyper, hypertrophic cells. Scale bar; 200 μm. Student's t-test was used for statistical analyses. **p < .01

