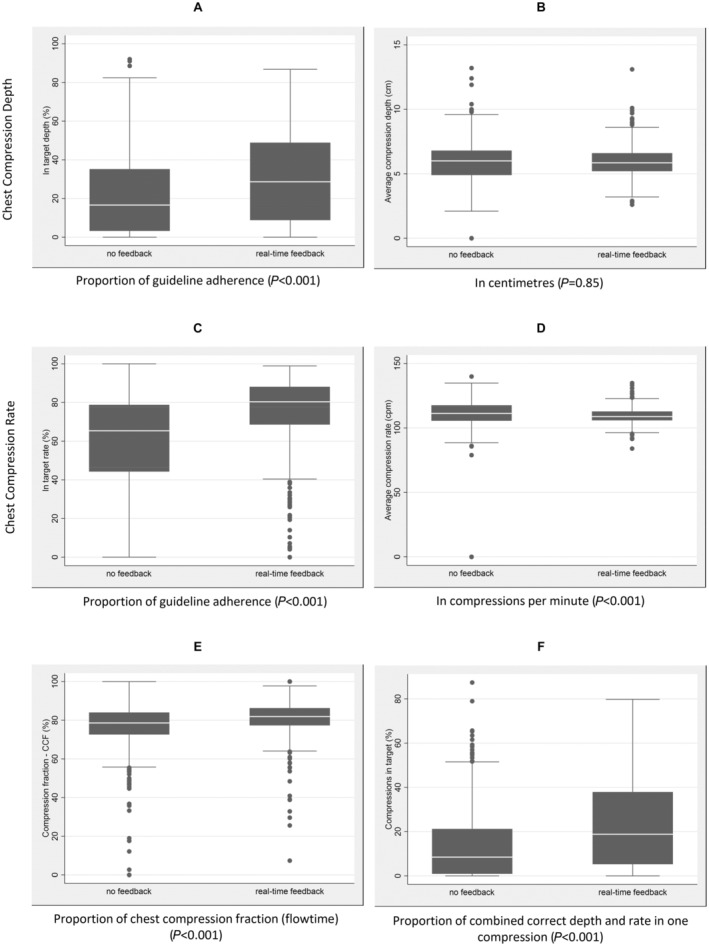
Figure 2. Chest compression quality.

A, Box plots of the proportion of chest compression depth in target. B, Box plots of chest compression depth in centimeters. C, Box plots of the proportion of chest compression rate in target. D, Box plots of chest compression rate in cpm. E, Box plots of CCF (flow time). F, Box plots of combined chest compression depth and rate proportion in target. CCF indicates chest compression fraction; and cpm, compressions per minute.
