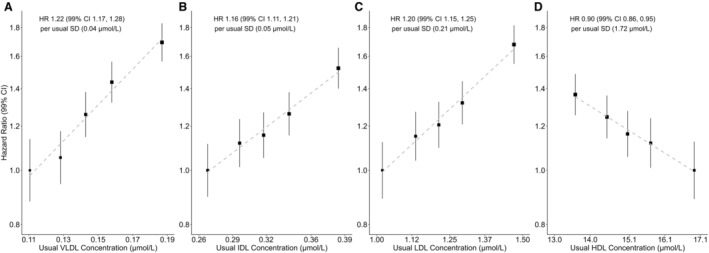
Figure 1. Lipoprotein particle concentration vs coronary heart disease risk.

Hazard ratios (HRs) per usual SD higher level of particle concentration among 89 422 participants (stratified by quintiles). A, Very‐low‐density lipoprotein (VLDL) particle concentration. B, Intermediate‐density lipoprotein (IDL) particle concentration. C, Low‐density lipoprotein (LDL) particle concentration. D, High‐density lipoprotein (HDL) particle concentration. HRs calculated by Cox proportional hazards models, stratified by age and sex, and adjusted for ethnicity, education, region, Townsend Deprivation Index, smoking, alcohol, and body mass index. “Usual” levels are estimated from the mean value at resurvey within each baseline‐defined group, providing an unbiased estimate of the long‐term average level in each baseline‐defined group. “Usual SD” was obtained from the baseline SD through multiplication by square root of the regression dilution ratio. Area of the square is inversely proportional to the variance of the category‐specific log risk. CI indicates confidence interval; HDL, high‐density lipoproteins; HR, hazard ratio; IDL, intermediate‐density lipoproteins; LDL, low‐density lipoproteins; SD, standard deviation; and VLDL, very‐low‐density lipoproteins.
