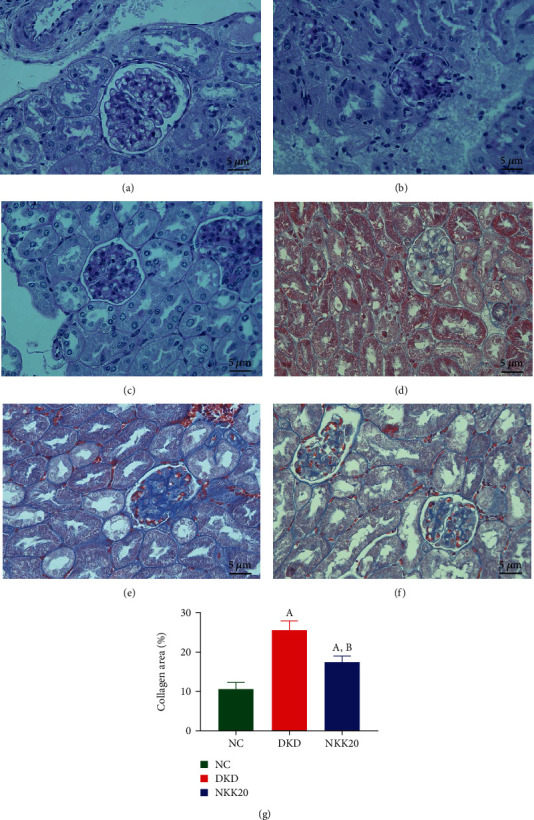
Figure 4.

H&E staining (a–c) and Masson staining (d–f) in mouse kidney tissues. (a) NC group, (b) DN group, (c) NKK20 group, (d) NC group, (e) DKD group, and (f) NKK20 group. (g) Compared with the NC group, P < 0.05 (A); compared with the DKD group, P < 0.05 (B).
