Figure 8.

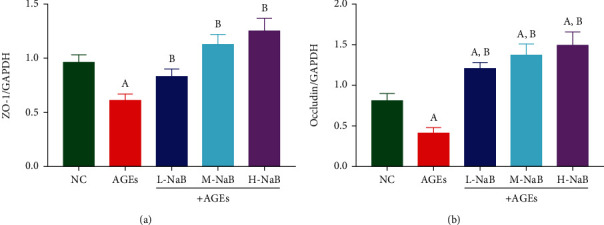
The expressions of ZO-1 and Occludin in HK-2 cells were determined by qPCR. (a) ZO1 mRNA level. (b) Occludin mRNA level. (A) Compared to the NC group, P < 0.05; (B) compared to the AGE group, P < 0.05.

The expressions of ZO-1 and Occludin in HK-2 cells were determined by qPCR. (a) ZO1 mRNA level. (b) Occludin mRNA level. (A) Compared to the NC group, P < 0.05; (B) compared to the AGE group, P < 0.05.