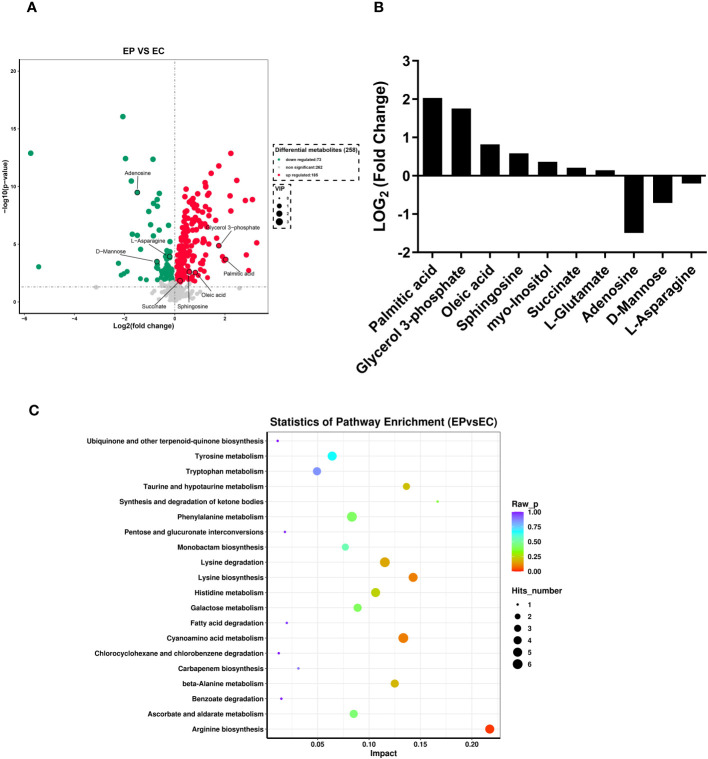
Figure 3.
Extracellular metabolites in CRAMP-34 treated PAO1 prebiofilms. Three-day-old preformed biofilms were treated by CRAMP-34 at 62.5 μg/mL for 1 hour. There were 6 samples in both the CRAMP-34 group and the control group. The samples were analyzed by LCMS, and the data were extracted and preprocessed using Mas-terView (SCIEX). (A) Volcano plots showed the fold change of extracellular metabolites in CRAMP-34 group (EP) vs control group (EC). The green dots represent significantly down-regulated metabolites (73), the red dots represent significantly up-regulated metabolites (185), and grey dots represent non-significantly changed differential metabolites. (B) Some representative differential metabolites. (C) The bubble diagram was analyzed using KEGG metabolism pathway enrichment. The p value is the significance of enrichment of this metabolic pathway. The ordinate is the name of the metabolic pathway; the abscissa is the rich factor. The larger the rich factor, the more metabolites enriched in the pathway. The size of the dots represents the number of differential metabolites enriched into the pathway.

