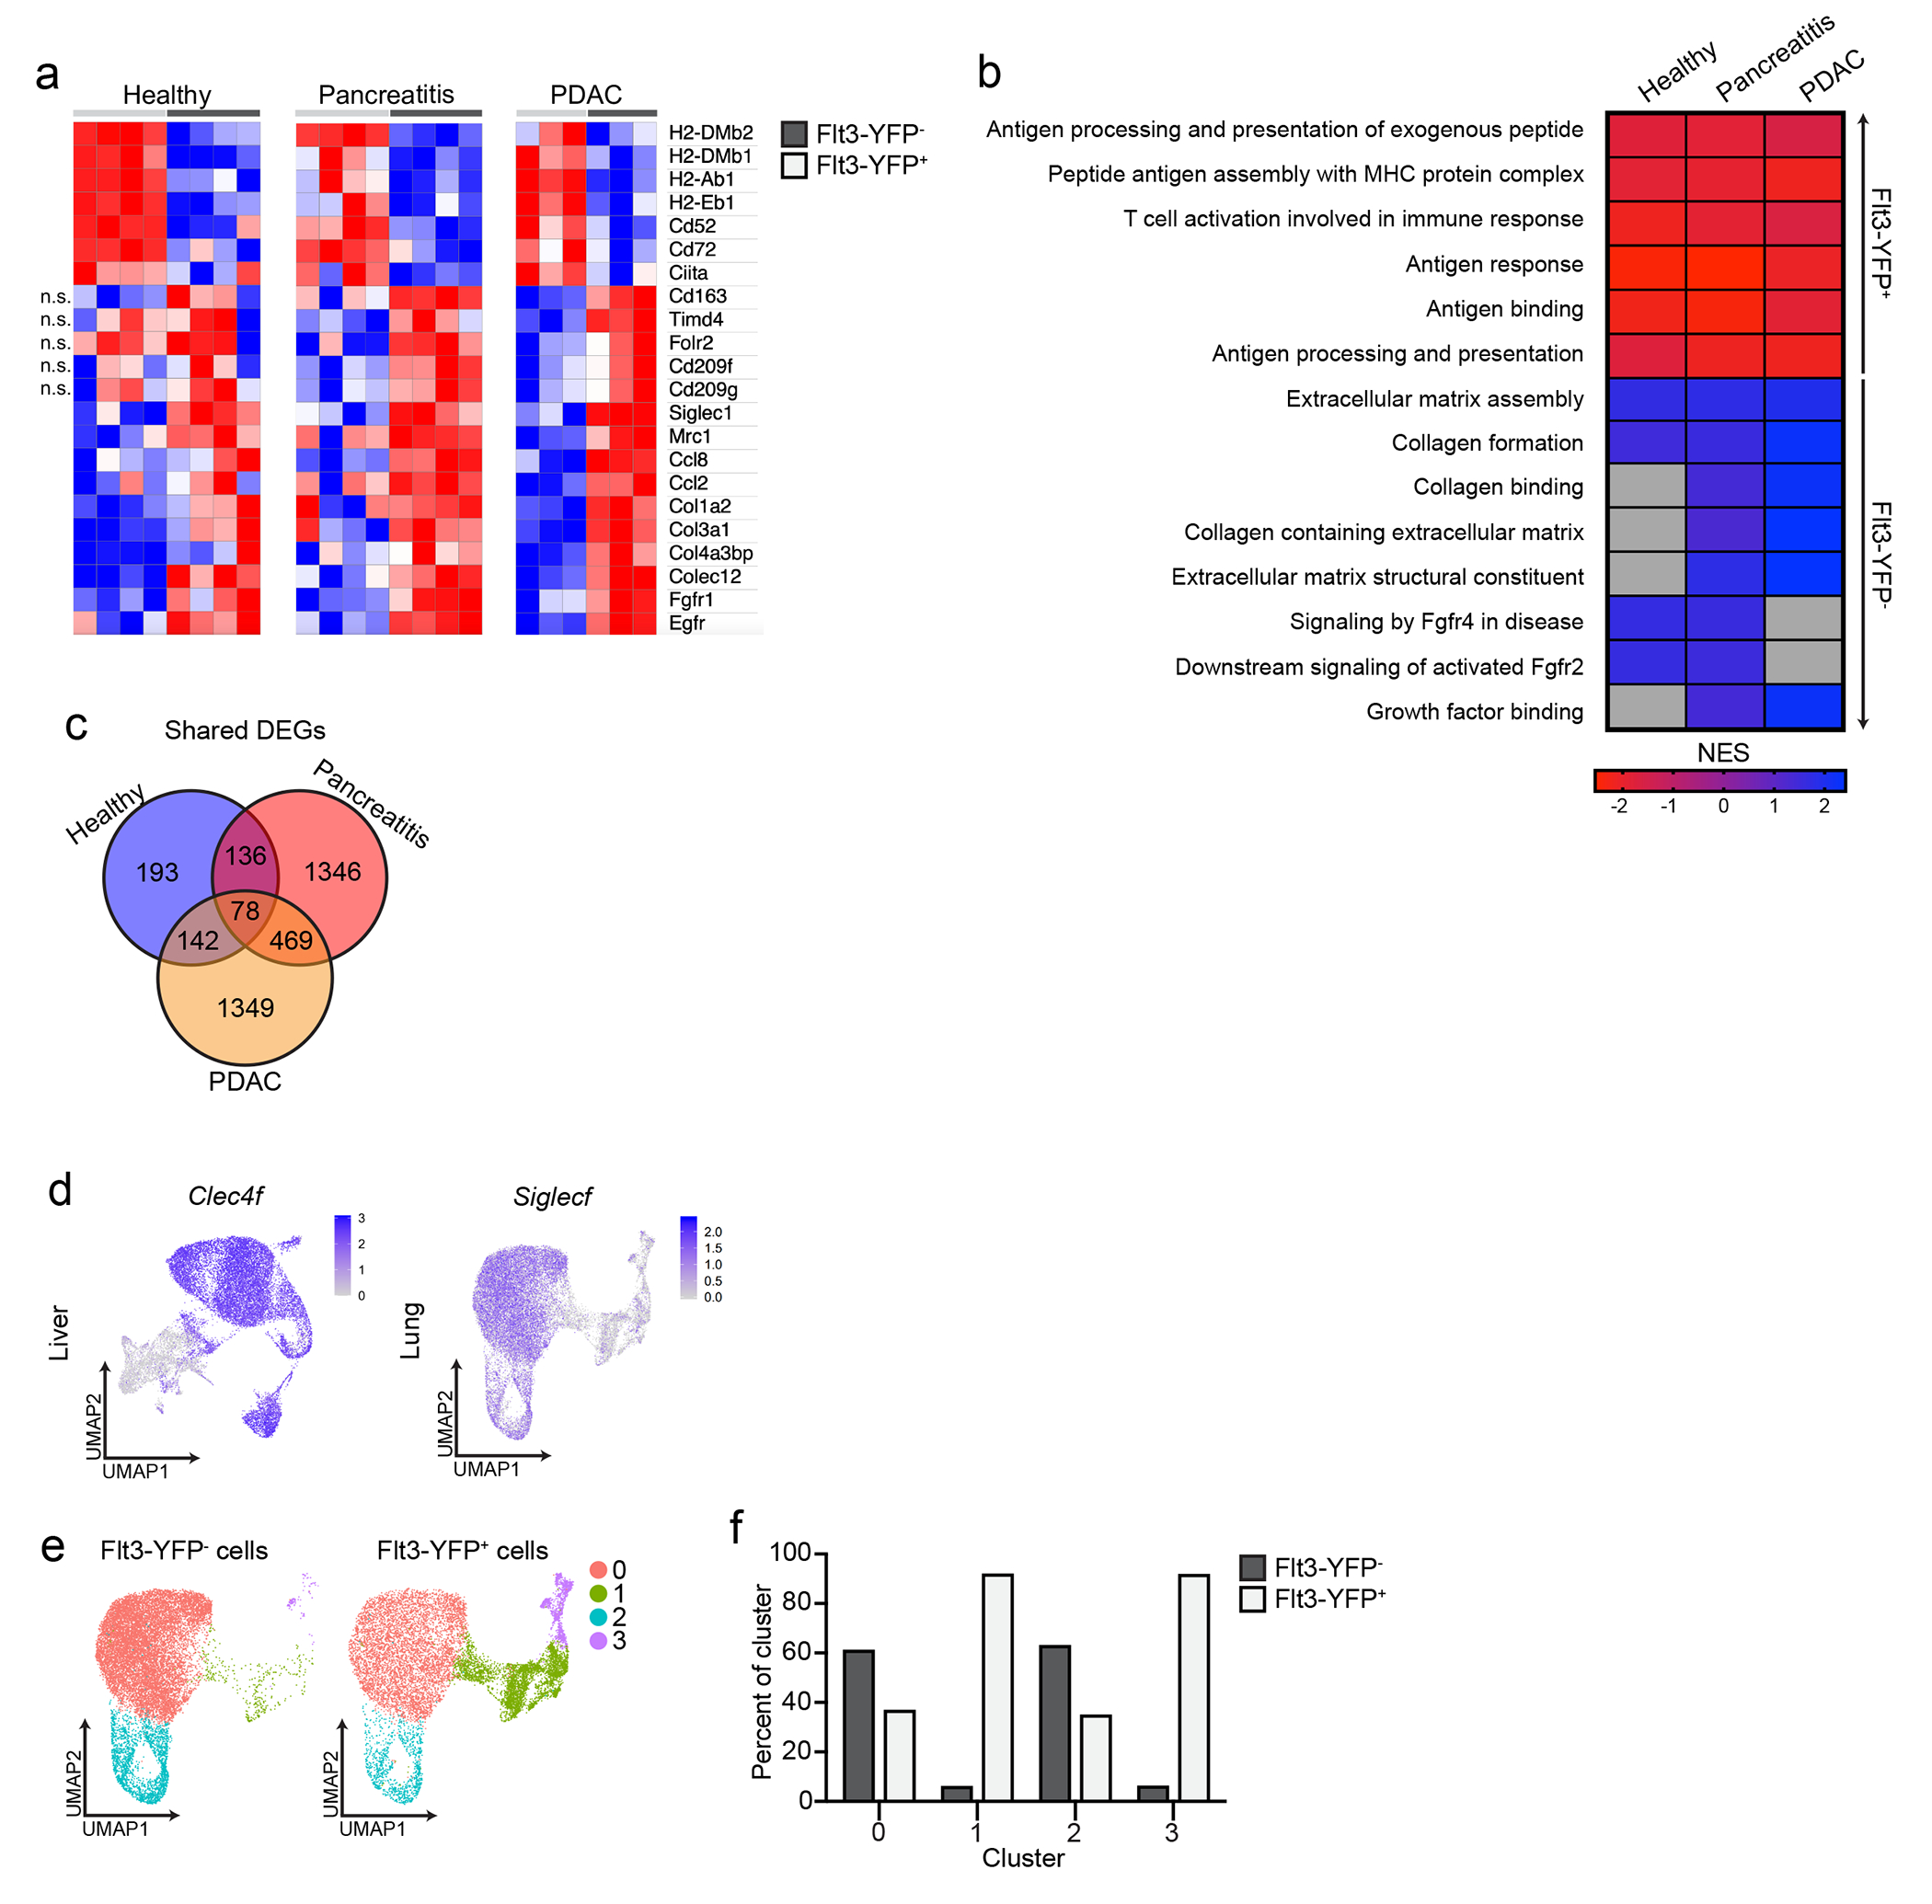
Extended Data Figure 3:

a. Heatmap displaying DEGs in bulk RNAseq data upregulated in Flt3-YFP+ or Flt3-YFP− pancreas macrophages from mice treated with 6 hourly i.p. injections every other day for one week of vehicle (healthy), cerulein (pancreatitis), or orthotopically implanted with the KP1 pancreatic cancer cell line (PDAC). b. Heatmap displaying normalized enrichment score (NES) of significantly enriched gene sets in bulk RNAseq data upregulated in Flt3-YFP+ or Flt3-YFP− pancreas macrophages of mice treated as in a, pathways selected by FDR < 0.05. c. Venn diagram of overlap in number of DEGs upregulated in Flt3-YFP+ or Flt3-YFP− pancreas macrophages from mice treated as in a. d. UMAP plot displaying Clec4f expression in F4/80+MHCIIhi/lo macrophages sorted from livers of Flt3-YFP mice 14 days after implantation with the KP2 pancreatic cancer cell line, and UMAP plot displaying Siglecf expression in CD11bint/hiCD11cint/hiF4/80+ macrophages from lungs of Flt3-YFP mice 15 days after i.v. injection of the KPL86 lung cancer cell line. e. UMAP plot from scRNAseq analysis of CD11bint/hiCD11cint/hiF4/80+ macrophages sorted from Flt3-YFP lungs implanted with KPL86 lung cancer cell line as in a. f. Quantification of Flt3-YFP+ and Flt3-YFP− lung macrophages by cluster from UMAP in e, displayed as percentage of each cluster.
