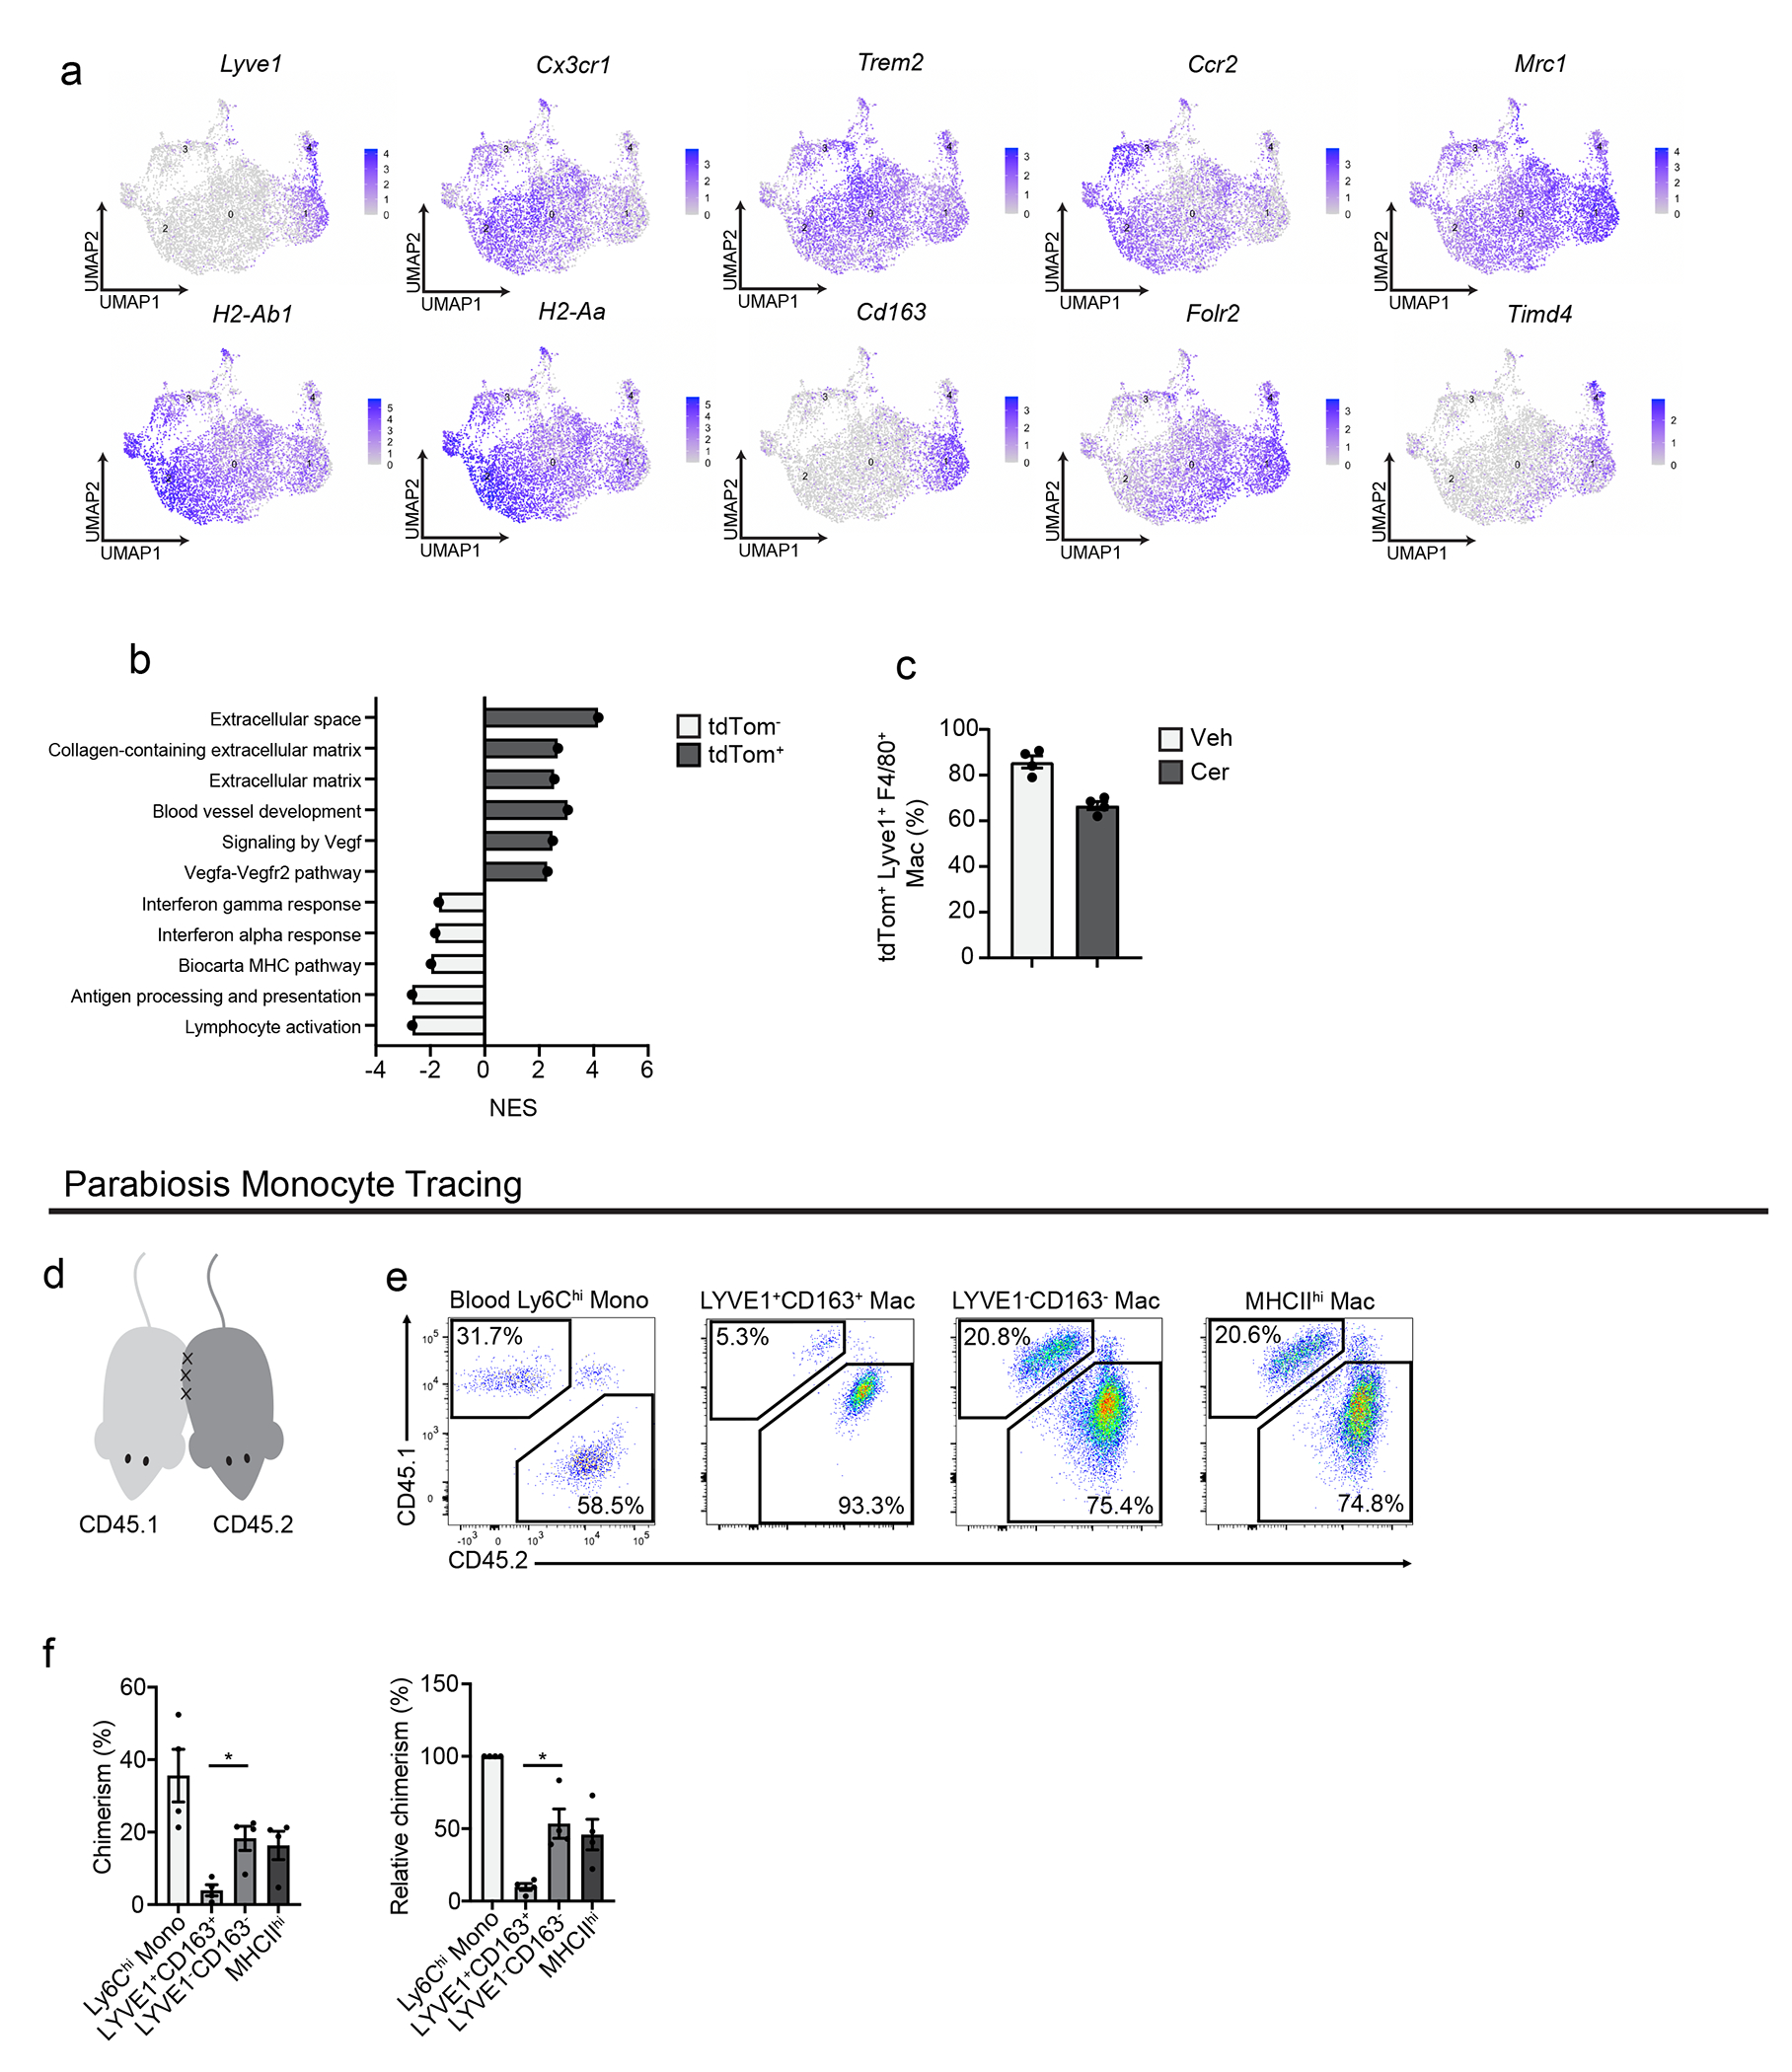
Extended Data Figure 5:

a. UMAP plots displaying Lyve1, Cx3cr1, Trem2, Ccr2, Mrc1, H2-Ab1, H2-Aa, Cd163, Folr2, and Timd4 expression in Csf1r and C1qa expressing pancreas macrophages from CSF1R- tdTom mice given tamoxifen by oral gavage for five consecutive days, then tamoxifen was stopped for 10 weeks, then cerulein (cer) was given by 6 hourly i.p. injections every other day for one week. b. Bar graph of NES values of gene sets upregulated in tdTomato+ or tdTomato− cells from CSF1R-tdTom mice treated as in a. c. Quantification of LYVE1+F4/80+tdTomato+ pancreas macrophages from CSF1R-tdTom mice treated with tamoxifen as in a, followed by vehicle (veh) or cerulein (cer) treatment as in a, displayed as percentage of LYVE1+F4/80+ macrophages; n=4 mice/group. d. Schematic of surgical joining of parabiotic pairs of CD45.1+ and CD45.2+ C57BL/6 mice. e. Flow cytometry staining of CD45.1 and CD45.2 in parabiotic pairs of mice, following 6 weeks of surgical joining, pre-gated on blood Ly6C+ monocytes or F4/80+MHCIIhi/lo pancreas macrophages. f. Quantification of percent chimerism (left) and chimerism normalized to blood Ly6Chi monocyte chimerism (relative chimerism, right) for blood Ly6Chi monocytes, LYVE1+CD163+ pancreas macrophages, LYVE1+CD163+ pancreas macrophages, and MHCIIhi pancreas macrophages; n=4 mice/group, *P=0.0286 for chimerism analysis and *P=0.0286 for relative chimerism analysis. Data are presented as mean ± SEM unless otherwise indicated. n.s., not significant; *p <0.05. For comparisons between two groups, Student’s two-tailed t-test was used, except b where FDR was used.
