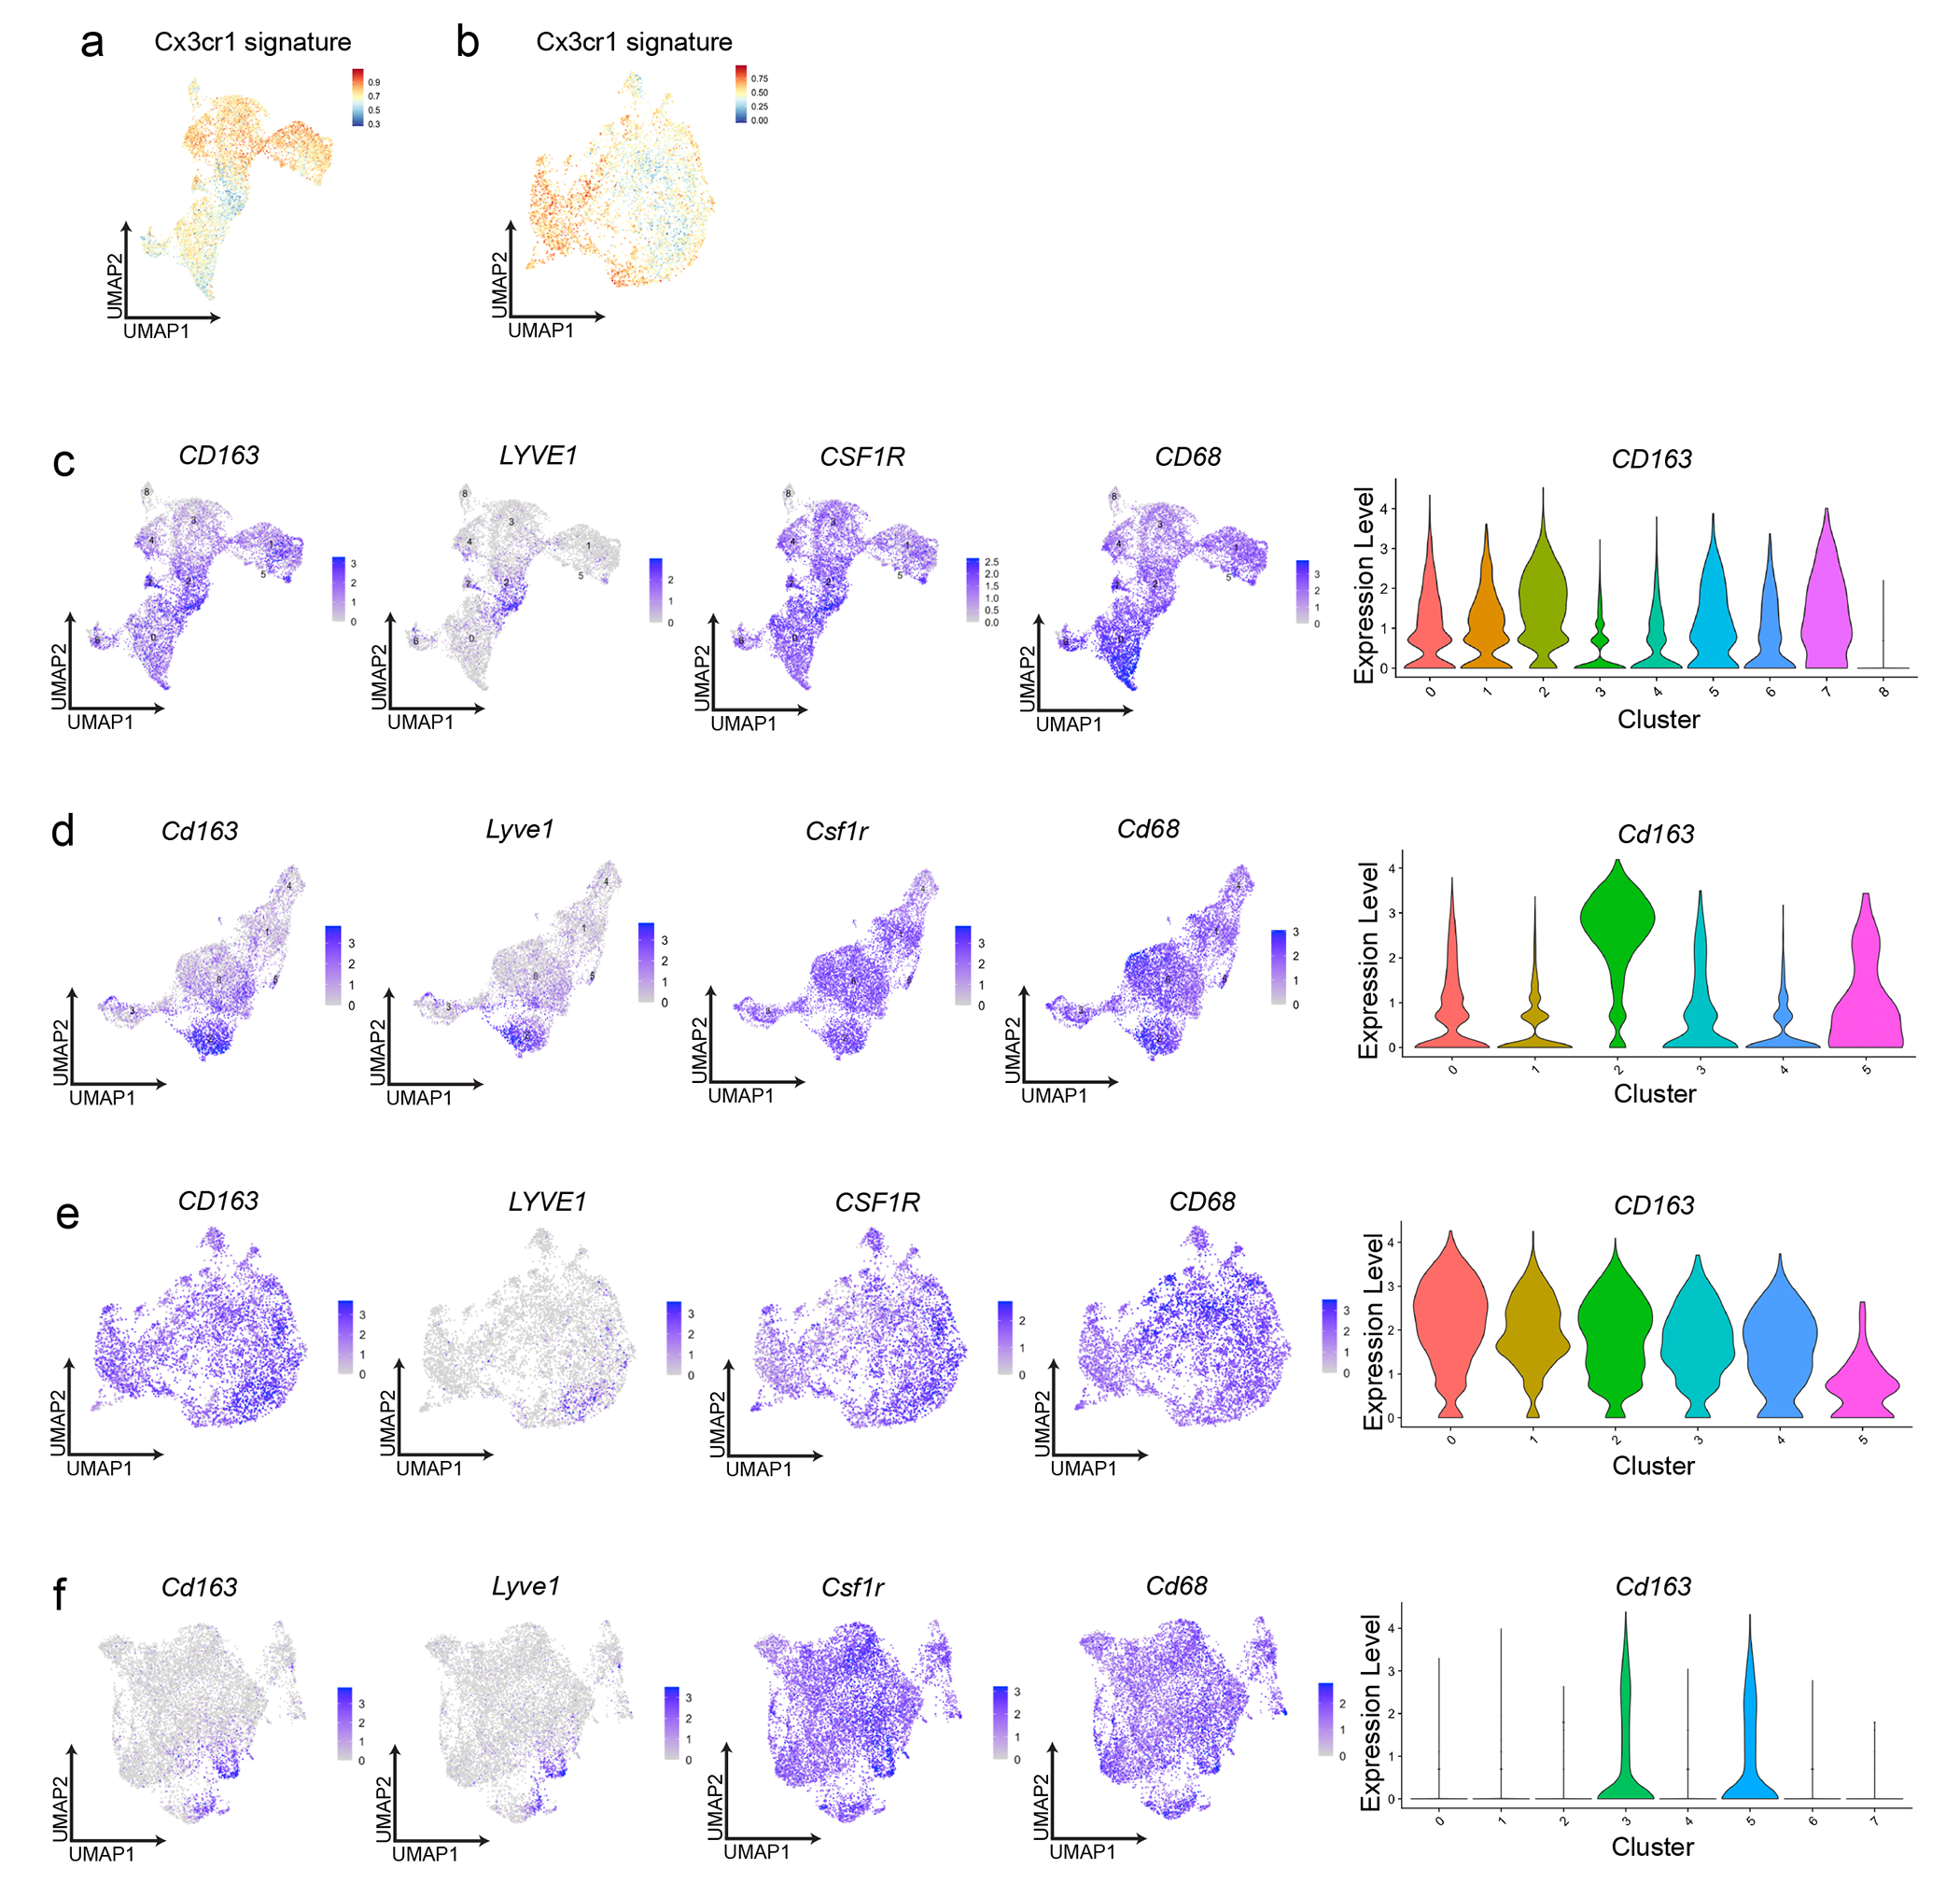
Extended Data Figure 6:

a. UMAP plot displaying mouse LYVE1lo pancreas macrophage scRNA-seq signature using top 100 DEGs from mouse LYVE1lo macrophages mapped into human chronic pancreatitis data set8. b. UMAP plot displaying mouse LYVE1lo pancreas macrophage scRNA-seq signature using top 100 DEGs from mouse LYVE1lo macrophages mapped into published human PDAC data set6. c. UMAP plots displaying CD163, LYVE1, CSF1R, and CD68 expression in human healthy and chronic pancreatitis samples from a, and violin plot showing CD163 gene expression across human pancreatitis macrophage clusters. d. UMAP plots displaying Cd163, Lyve1, Csf1r, and Cd68 expression in scRNA-seq of F4/80+MHCIIhi/lo macrophages sorted from the pancreas of Flt3-YFP mice treated with cerulein by 6 hourly i.p. injections every other day for one week, and violin plot showing Cd163 gene expression across same dataset of mouse pancreas macrophage clusters. e. UMAP plots displaying CD163, LYVE1, CSF1R, and CD68 expression in macrophages from human PDAC data set as in b, and violin plot showing CD163 gene expression across human PDAC macrophage clusters. f. UMAP plots displaying Cd163, Lyve1, Csf1r, and Cd68 expression in mouse F4/80+MHCIIhi/lo macrophages sorted from pancreas of Flt3-YFP mice orthotopically implanted with the KP1 pancreatic cancer cell line, and violin plot showing Cd163 gene expression across same dataset of mouse PDAC macrophage clusters.
