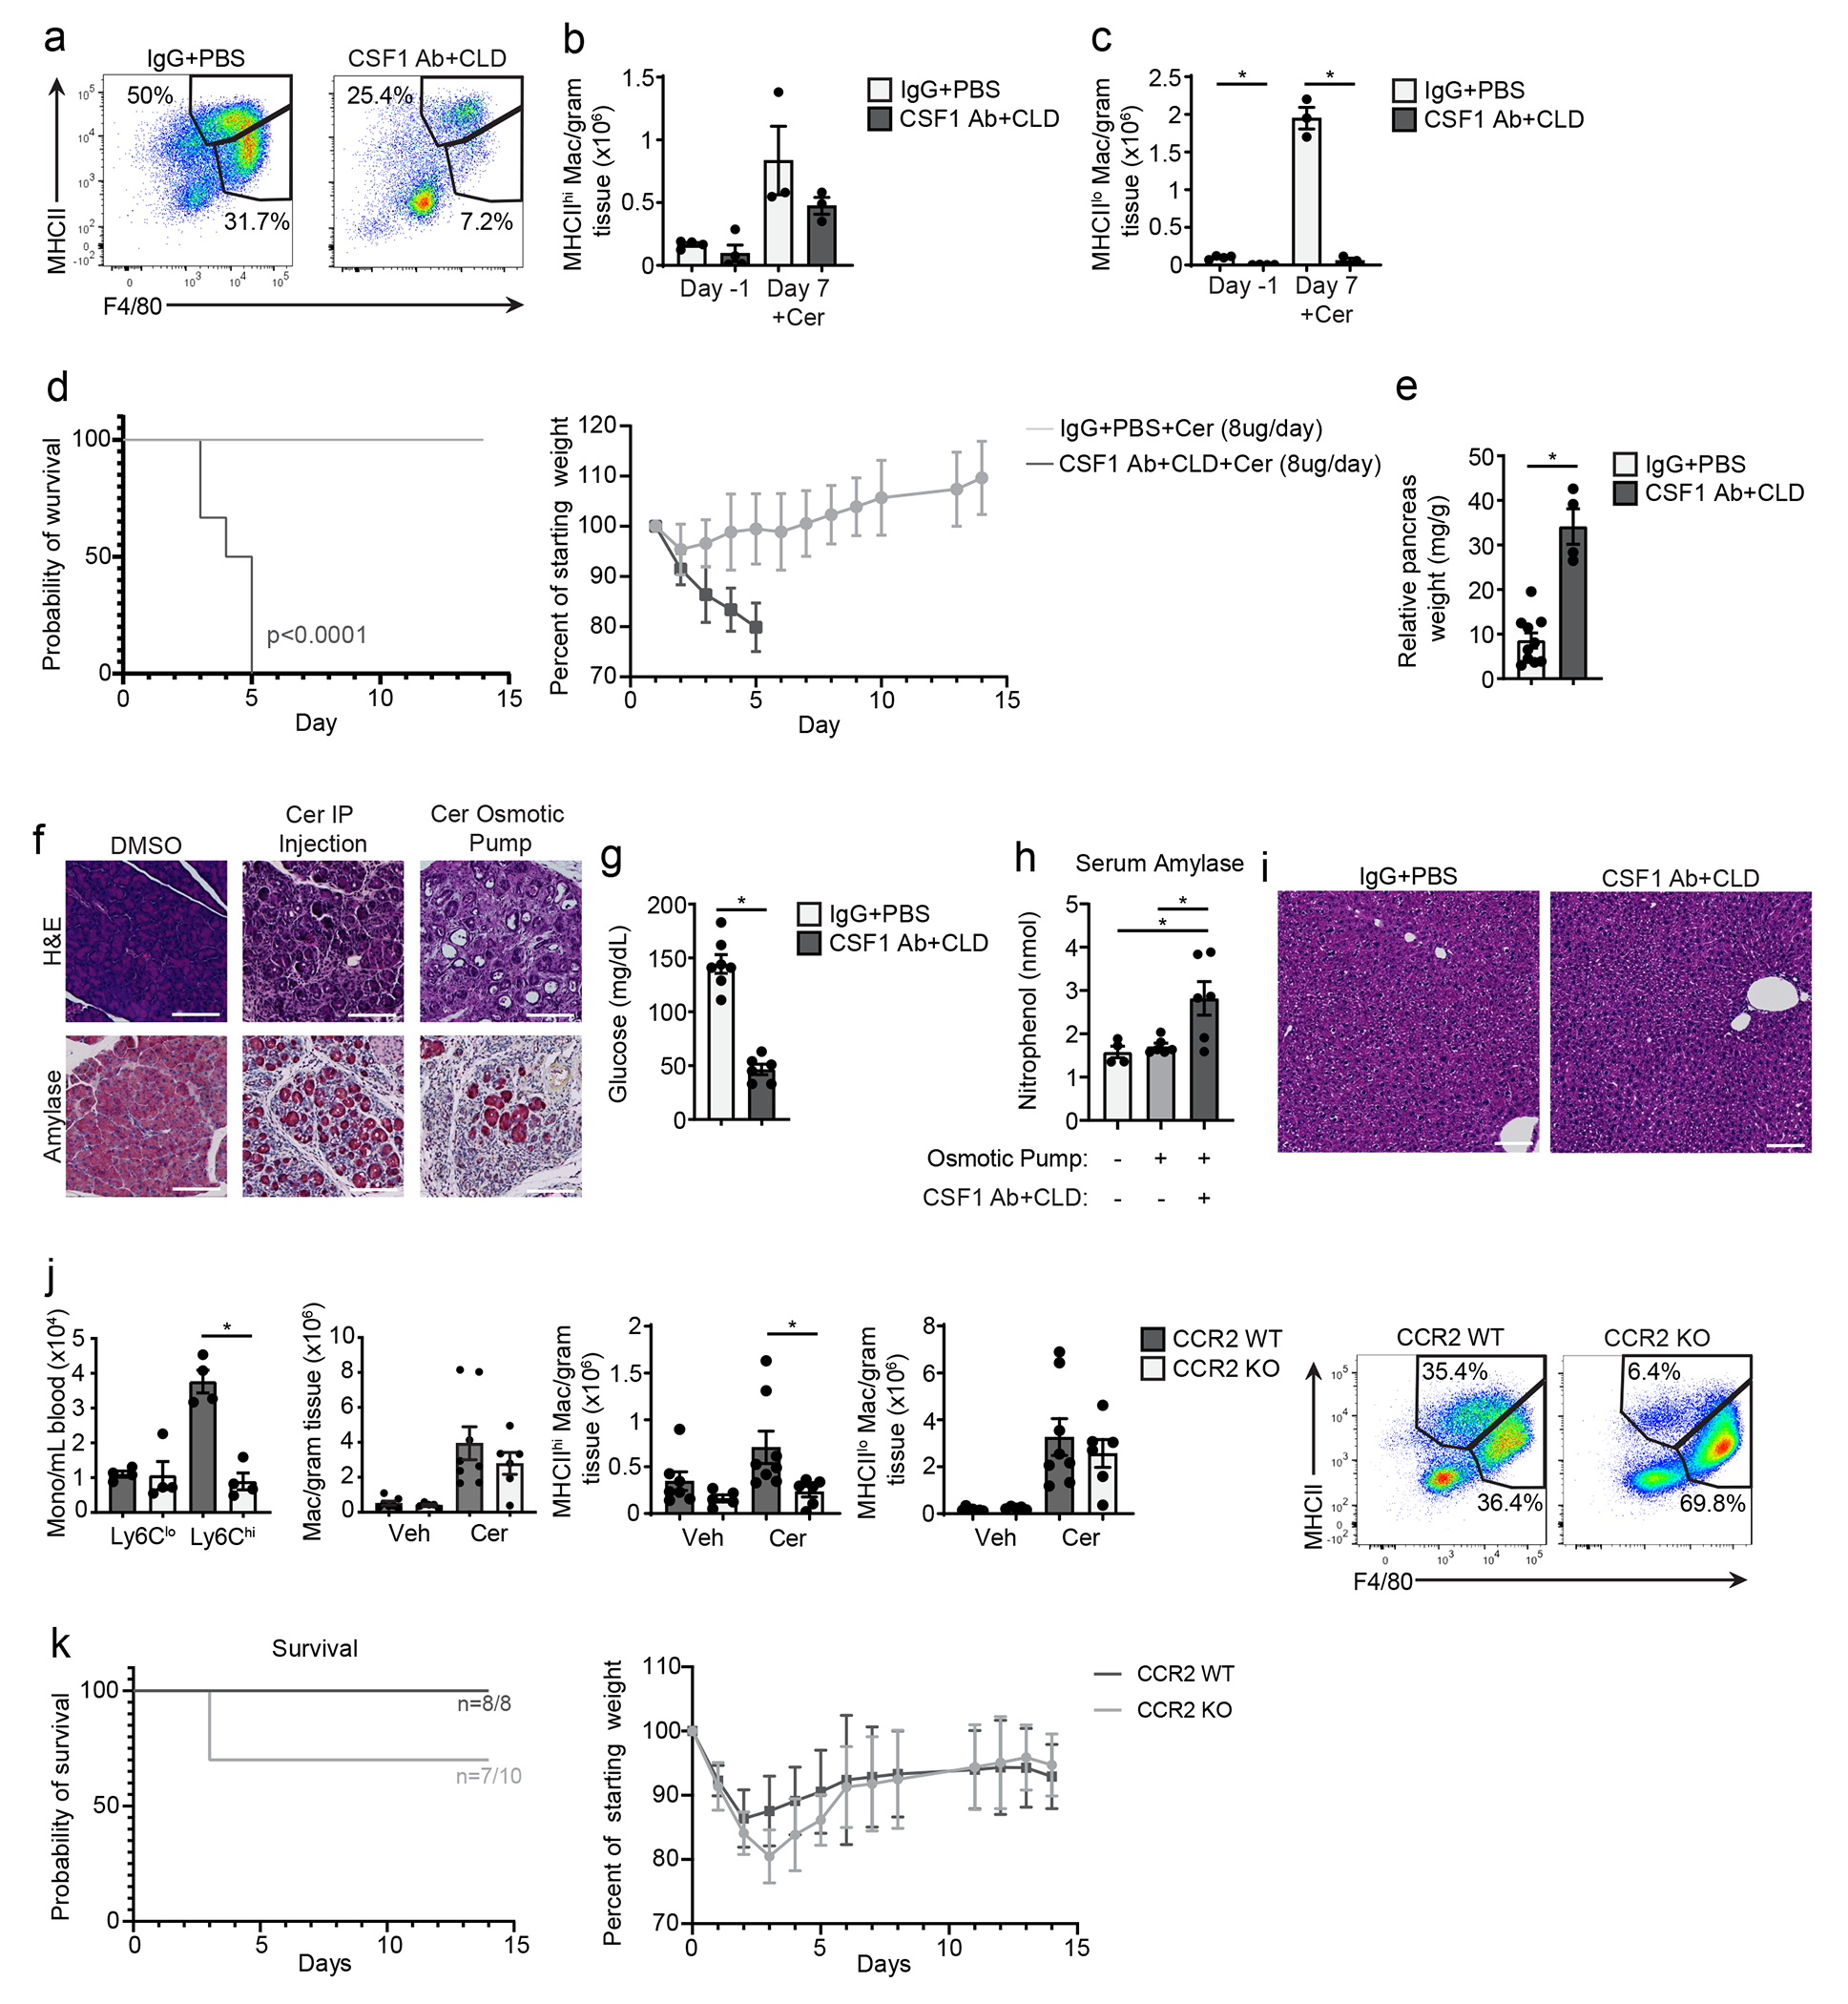
Extended Data Figure 7:

a. Flow cytometry of pancreas F4/80+MHCIIhi/lo macrophages after treatment with CSF1Ab+CLD or IgG+PBS, then a 10-day recovery period (day −1), then cerulein (cer) treatment by 6 hourly i.p. injections every other day for one week (day 7). b. Density of MHCIIhi pancreas macrophages from mice treated as in a; day −1, n=4mice/group; day 7, n=3mice/group. c. Density of MHCIIlo pancreas macrophages from mice treated as in a; day −1, n=4mice/group; day 7, n=3mice/group, left to right *P=0.0002 and *P=0.0002. d. Kaplan-Meier survival curve and body weight measurement of C57BL/6 mice treated with IgG+PBS or CSF1Ab+CLD as in a, followed by cerulein-loaded osmotic pump (10μg/day cerulein) implantation; IgG+PBS, n=10mice; CSF1 Ab+CLD, n=6mice, *P<0.0001 in survival analysis. e. Relative pancreas weight in C57BL/6 mice treated as in d; IgG+PBS, n=10mice, CSF1Ab+CLD, n=4mice, *P<0.0020. f. IHC images of H&E and amylase stain in pancreas from mice implanted with DMSO-loaded osmotic pump, cerulein treatment as in a, or cerulein-loaded osmotic pump, scale bars, 100μM. g. Blood glucose concentration at humane survival endpoint in mice treated as in d; IgG+PBS, n=7mice; CSF1Ab+CLD, n=6mice, *P=0.0012. h. Serum amylase level in mice treated as in f; left to right n=4mice, n=6mice, and n=6mice, and *P=0.0381 and *P=0.0390. i. H&E-stained liver from mice treated as in f, scale bars, 100μM. j. Blood Ly6Clo and Ly6Chi monocytes, and pancreas F4/80+, F4/80+MHCIIhi, and F4/80+MHCIIlo macrophages, and flow cytometry of F4/80+MHCIIhi/lo pancreas macrophages in CCR2-WT and CCR2-KO mice treated with cerulein by i.p. injection as in a; n=4 mice/group and *P=0.0286 in blood Ly6Clo and Ly6Chi analysis, n=7 mice in veh CCR2-WT group, n=5 mice in veh CCR2-KO group, n=8 mice in cer CCR2-WT group, and n=6 in cer CCR2-KO group in F4/80+, F4/80+MHCIIhi, and F4/80+MHCIIlo analyses, and *P=0.0047 in F4/80+MHCIIhi macrophage analysis. k. Kaplan-Meier survival curve and body weight measurement of CCR2-WT and CCR2-KO mice implanted with cerulein-loaded osmotic pumps, as in d; n=8 mice in CCR2-WT group, n=10 mice in CCR2-KO group. Data are presented as mean ± SEM unless otherwise indicated. n.s., not significant; *p <0.05. For comparisons between two groups, Student’s two-tailed t-test was used.
