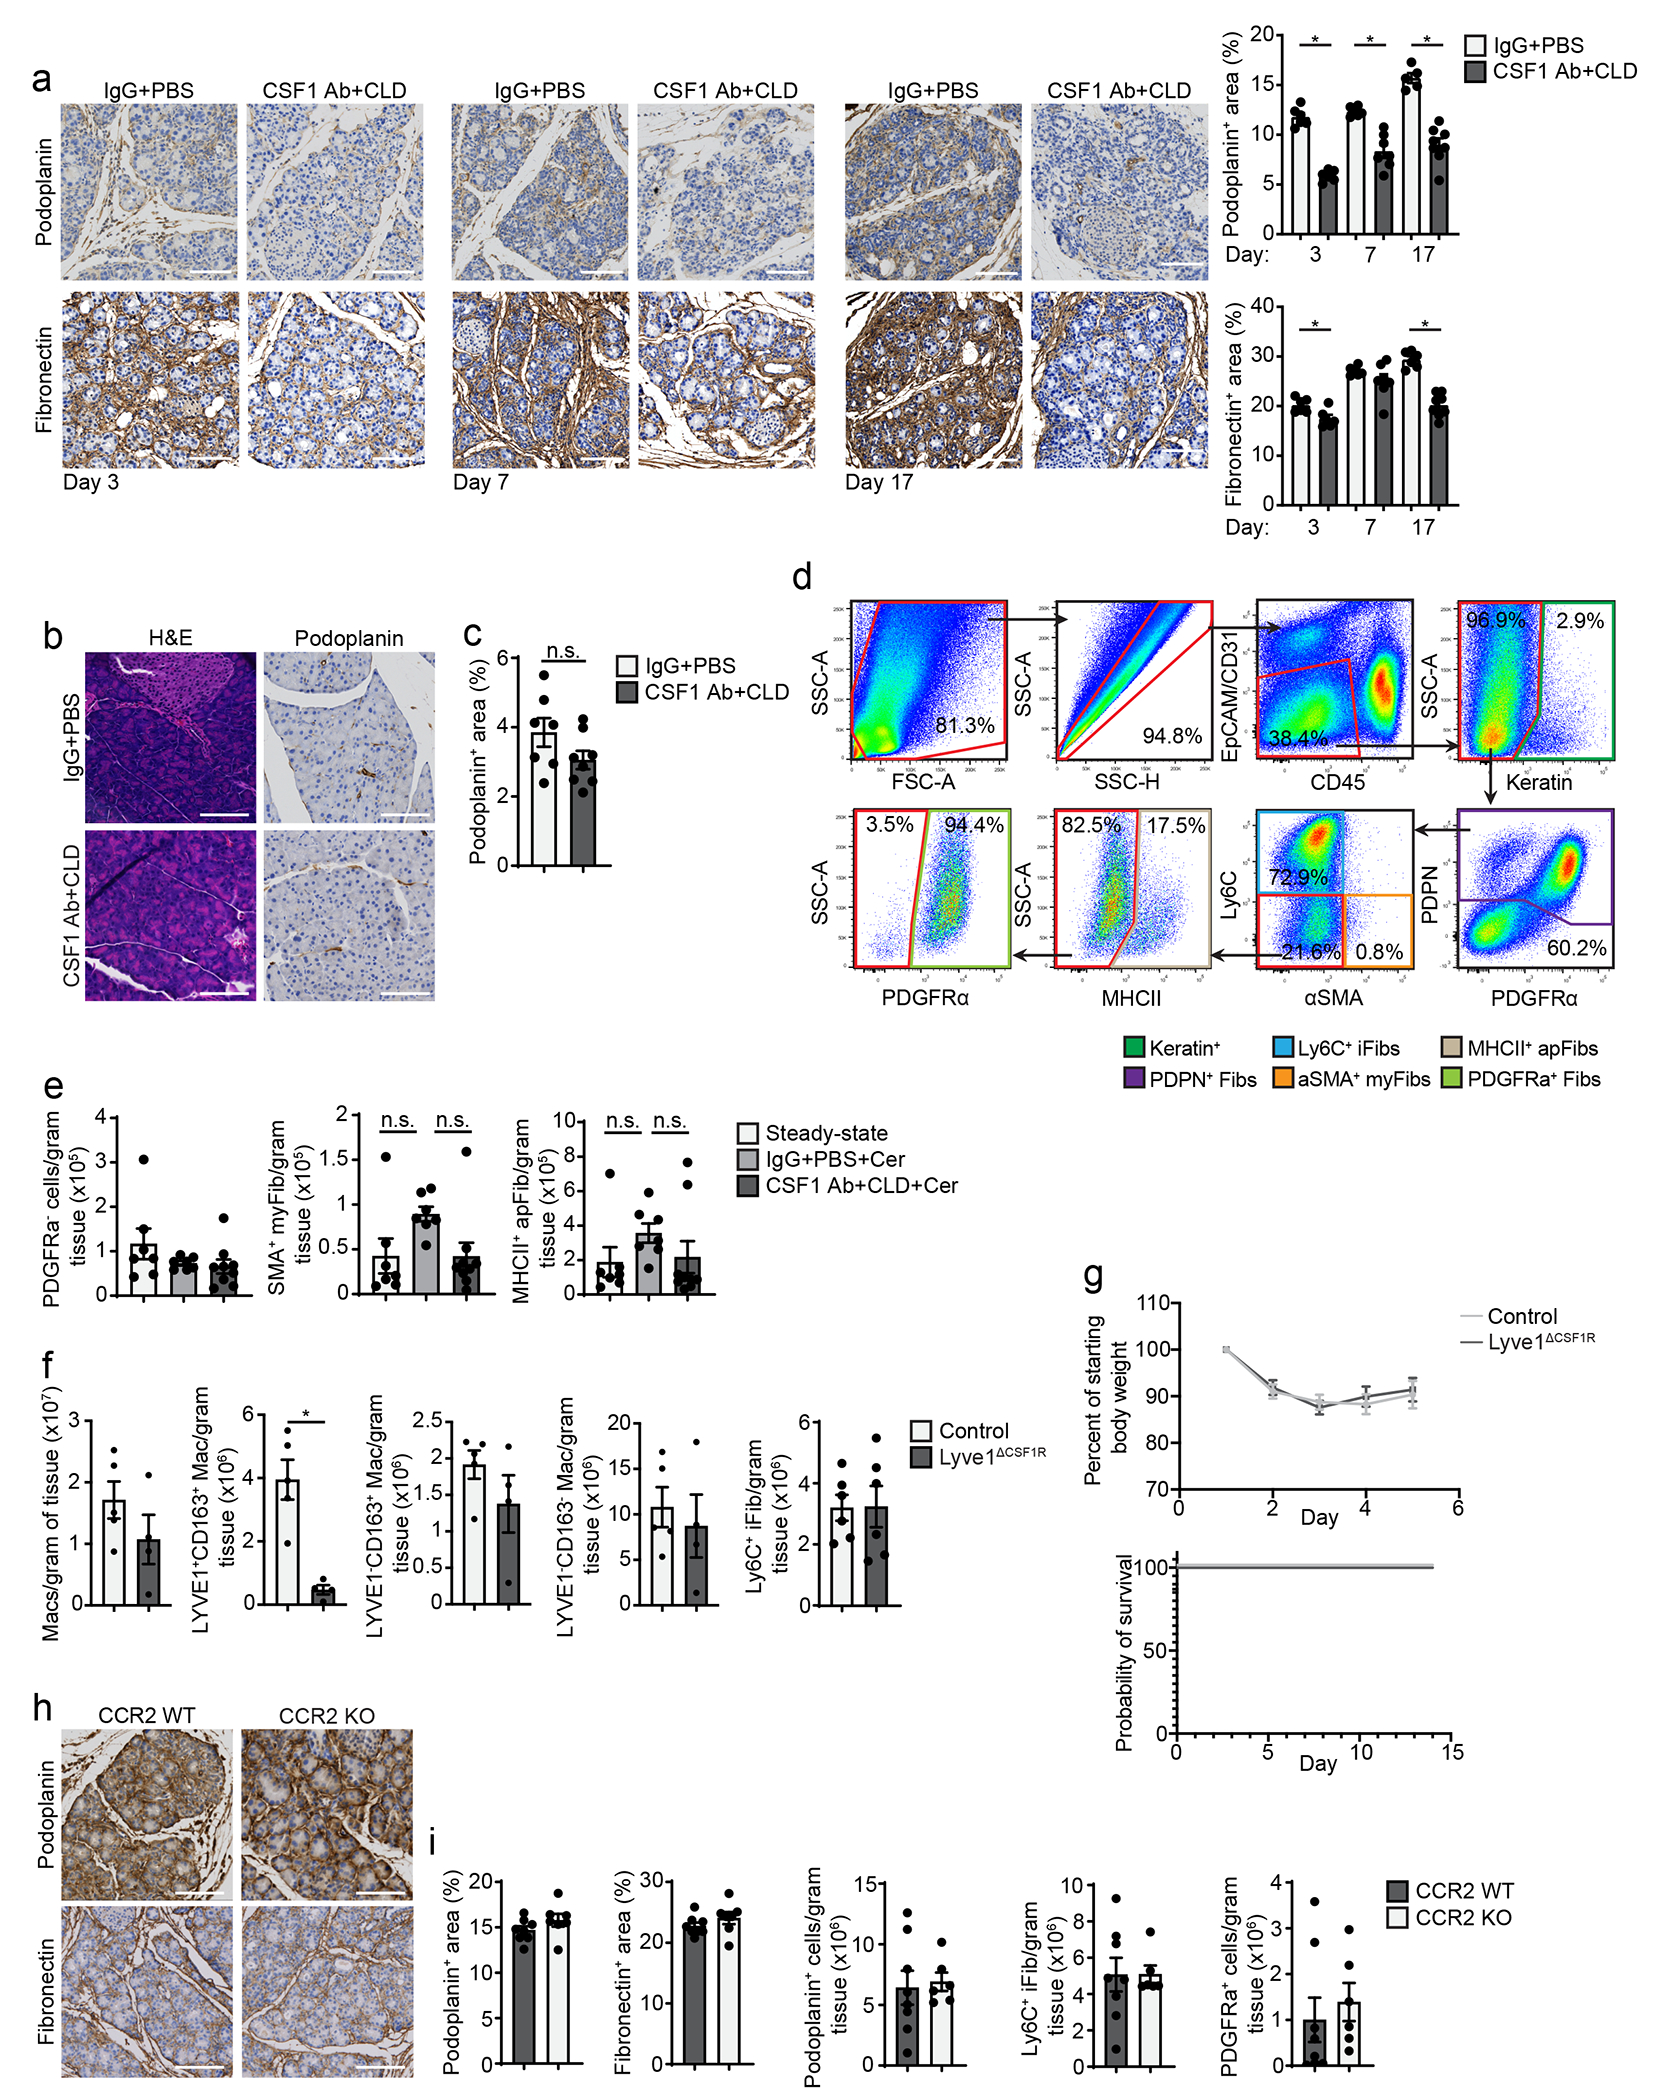
Extended Data Figure 8:

a. IHC staining and quantification for podoplanin and fibronectin on pancreas tissue from mice treated with CSF1Ab+CLD or IgG+PBS, then a 10-day recovery period, then cerulein (cer) treatment by 6 hourly i.p. injections every other day for 3, 7, or 17 days, scale bars, 100μM, IgG+PBS, CSF1Ab+CLD day 3, and IgG+PBS day 7, n=6mice; CSF1Ab+CLD day 7, n=7mice; IgG+PBS day 17, n=5mice; CSF1Ab+CLD day 17, n=8mice; podoplanin left to right, *P=0.0022, *P=0.0012, and *P=0.0016; fibronectin left to right, *P=0.0130 and *P=0.0007. b. H&E and podoplanin stained pancreas tissue from mice treated as in a, with no cerulein treatment, scale bars, 100μM. c. Podoplanin IHC quantification on pancreas tissue of mice treated as in b; IgG+PBS, n=7mice; CSF1Ab+CLD, n=8mice. d. Flow cytometry gating for pancreas fibroblast subsets. e. Density of pancreas PDGFRα−, α-SMA+, and MHCII+ fibroblasts from mice treated with IgG+PBS followed by vehicle (steady-state), IgG+PBS followed by cerulein (IgG+PBS+Cer), and CSF1Ab+CLD followed by cerulein (CSF1 AB+CLD+Cer) as in a; steady-state and IgG+PBS+Cer, n=7mice, and CSF1Ab+CLD+Cer, n=9mice. f. Density of pancreas F4/80+MHCIIhi/lo, LYVE1+CD163+, LYVE1−CD163+, LYVE1−CD163− macrophages, and Ly6C+ iFibs in Lyve1-Cre− littermate controls (control), or Lyve1ΔCSF1R mice treated with cerulein by i.p. injections every other day for one week; control, n=5mice; Lyve1ΔCSF1R, n=4mice; LYVE1+CD163+, *P=0.0159, and Ly6C+ iFib, n=6mice/group. g. Mouse body weight measurement and Kaplan-Meier survival curve following implantation of osmotic pump for delivery of 10μg/day cerulein in control or Lyve1ΔCSF1R mice; n=9 mice in control and n=8 mice in Lyve1ΔCSF1R group. h. Podoplanin and fibronectin IHC staining on pancreas tissue of CCR2-WT and CCR2-KO mice treated with cerulein as in f; scale bars, 100μM. i. Quantification of podoplanin and fibronectin IHC stains and density of podoplanin+ fibroblasts, Ly6C+ iFibs, and PDGFRα+ fibroblasts in pancreas tissue of CCR2-WT and CCR2-KO mice treated with cerulein as in f; CCR2-WT, n=8mice; CCR2-KO, n=7mice for podoplanin and fibronectin IHC analyses, and CCR2-WT, n=8mice; CCR2-KO, n=6mice for fibroblast flow cytometry analyses. Data are presented as mean ± SEM unless otherwise indicated. n.s., not significant; *p <0.05. For comparisons between two groups, Student’s two-tailed t-test was used.
