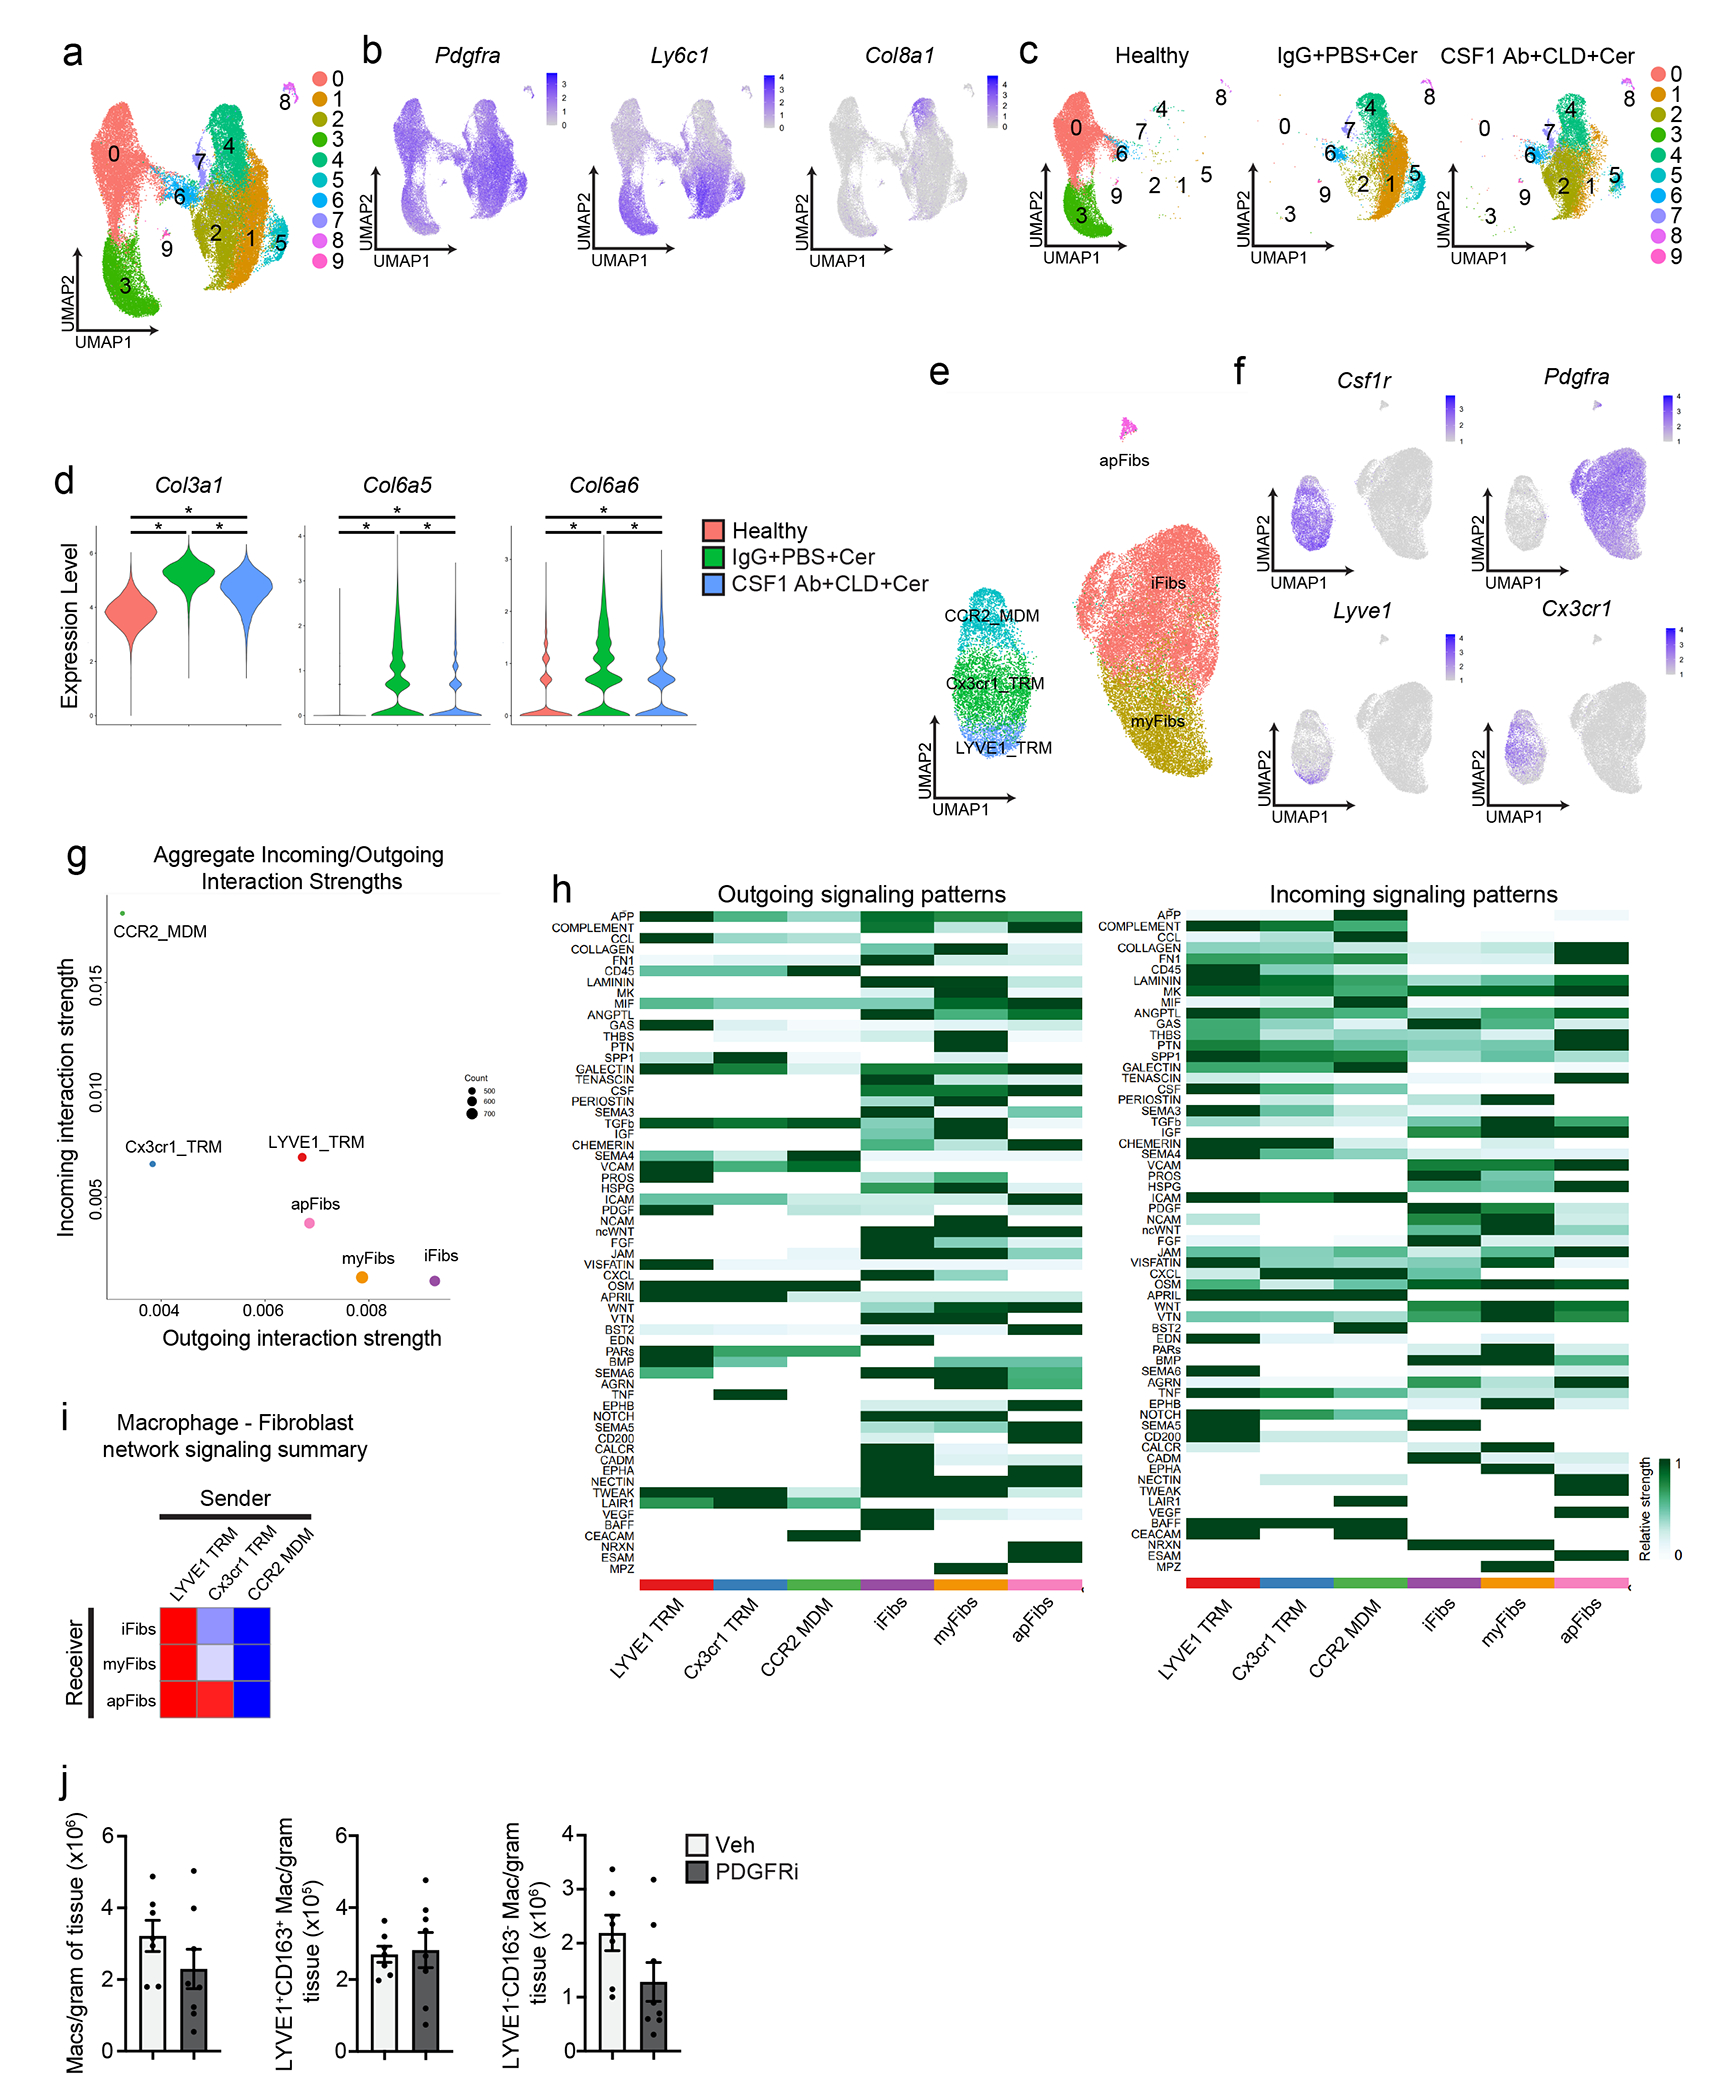
Extended Data Figure 9:

a. UMAP plot of scRNA-seq analysis of PDPN+ pancreas fibroblasts sorted from mice treated with IgG+PBS followed by vehicle (healthy), IgG+PBS followed by cerulein (IgG+PBS+Cer), and CSF1 Ab+CLD followed by cerulein (CSF1 Ab+CLD+Cer). b. UMAP plots displaying expression of Pdgfra, Ly6c1, and Col8a1 in PDPN+ fibroblasts from a. c. UMAP plot of pancreas PDPN+ fibroblasts separated by healthy, IgG+PBS+Cer, or CSF1 Ab+CLD+Cer samples as in a. d. Violin plot of Col3a1, Col6a5, and Col6a6 expression across samples (healthy, IgG+PBS+Cer, or CSF1 Ab+CLD+Cer); for all comparisons *P<0.0001. e. UMAP plot of scRNA-seq analysis combining macrophages from Flt3-YFP mice treated with cerulein and fibroblasts from IgG+PBS+Cer and CSF1 Ab+CLD+Cer treated mice. f. UMAP plots displaying Csf1r, Pdgfra, Lyve1, and Cx3cr1 expression in combined macrophage and fibroblast scRNA-seq analysis from e. g. Dot plot showing aggregate score of all incoming (receptor) and outgoing (ligand) interactions summarized for each macrophage and fibroblast cluster from e, as measured by CellChat9. h. Heatmap displaying relative strength of network centrality measures for outgoing (ligands, left heatmap) and incoming (receptors, right heatmap) signaling patterns of each intercellular signaling pathway. i. Heatmap displaying aggregate score across all differentially enriched receptor (receiver) or ligand (sender) pathways between macrophage and fibroblast clusters from e. j. Density of pancreas F4/80+MHCIIhi/lo, LYVE1+CD163+, and LYVE1−CD163− macrophages from mice treated with vehicle (veh) or PDGFRi once per day by i.p. injection along with cerulein treatment by 6 hourly i.p. injections every other day for one week; n=7 mice in vehicle and n=8 mice in PDGFRi groups. Data are presented as mean ± SEM unless otherwise indicated. n.s., not significant; *p <0.05. For comparisons between two groups, Student’s two-tailed t-test was used, except for d where Bonferroni correction was used.
